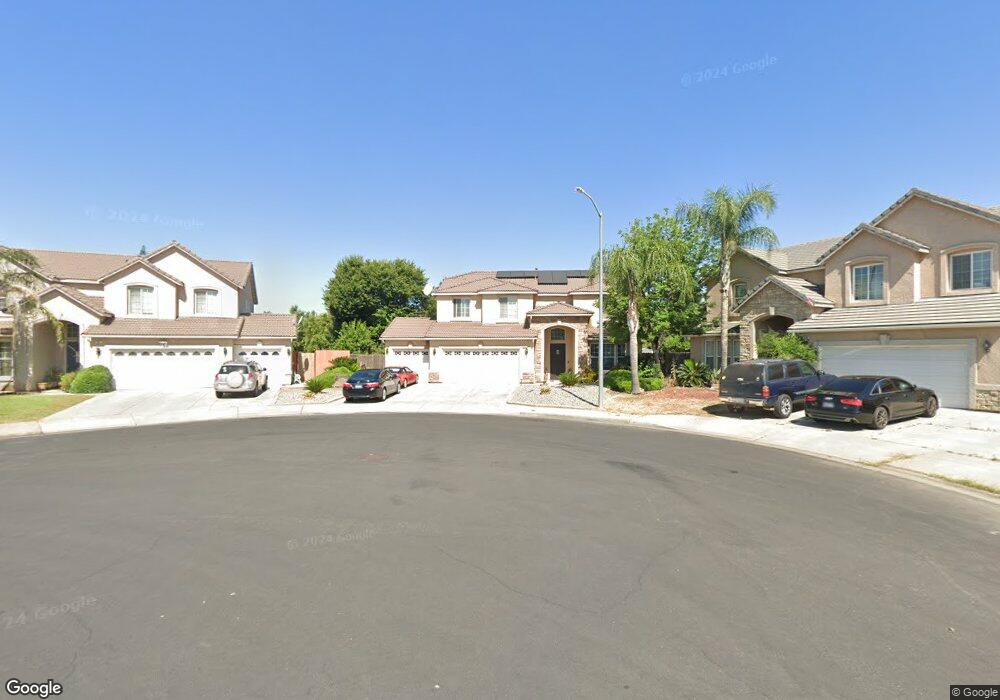
910 Hanson Ave Clovis, CA 93611
Estimated Value: $572,732 - $617,000
5
Beds
4
Baths
2,687
Sq Ft
$222/Sq Ft
Est. Value
About This Home
This home is located at 910 Hanson Ave, Clovis, CA 93611 and is currently estimated at $596,577, approximately $222 per square foot. 910 Hanson Ave is a home located in Fresno County with nearby schools including Red Bank Elementary School, Clark Intermediate School, and Clovis High School.
Ownership History
Date
Name
Owned For
Owner Type
Purchase Details
Closed on
Aug 26, 2005
Sold by
Bounkhoune Phonesavanh and Bounkhoune Saysamone
Bought by
Bounkhoune Saysamone and Bounkhoune Phonesavanh
Current Estimated Value
Home Financials for this Owner
Home Financials are based on the most recent Mortgage that was taken out on this home.
Original Mortgage
$350,000
Outstanding Balance
$184,773
Interest Rate
5.64%
Mortgage Type
New Conventional
Estimated Equity
$411,804
Purchase Details
Closed on
Oct 25, 2002
Sold by
Fox Run Llc
Bought by
Bounkhoune Phonesavanh and Bounkhoune Saysamone
Home Financials for this Owner
Home Financials are based on the most recent Mortgage that was taken out on this home.
Original Mortgage
$254,983
Interest Rate
5.71%
Purchase Details
Closed on
Oct 26, 2001
Sold by
Tatham William
Bought by
Fox Run Llc
Create a Home Valuation Report for This Property
The Home Valuation Report is an in-depth analysis detailing your home's value as well as a comparison with similar homes in the area
Home Values in the Area
Average Home Value in this Area
Purchase History
| Date | Buyer | Sale Price | Title Company |
|---|---|---|---|
| Bounkhoune Saysamone | -- | Stewart Title Of Fresno Cnty | |
| Bounkhoune Phonesavanh | $268,500 | North American Title Co Inc | |
| Fox Run Llc | -- | North American Title Co |
Source: Public Records
Mortgage History
| Date | Status | Borrower | Loan Amount |
|---|---|---|---|
| Open | Bounkhoune Saysamone | $350,000 | |
| Previous Owner | Bounkhoune Phonesavanh | $254,983 |
Source: Public Records
Tax History
| Year | Tax Paid | Tax Assessment Tax Assessment Total Assessment is a certain percentage of the fair market value that is determined by local assessors to be the total taxable value of land and additions on the property. | Land | Improvement |
|---|---|---|---|---|
| 2025 | $4,827 | $401,891 | $101,370 | $300,521 |
| 2023 | $4,632 | $386,287 | $97,435 | $288,852 |
| 2022 | $4,571 | $378,714 | $95,525 | $283,189 |
| 2021 | $4,445 | $371,289 | $93,652 | $277,637 |
| 2020 | $4,428 | $367,483 | $92,692 | $274,791 |
| 2019 | $4,343 | $360,278 | $90,875 | $269,403 |
| 2018 | $4,250 | $353,215 | $89,094 | $264,121 |
| 2017 | $4,166 | $346,291 | $87,348 | $258,943 |
| 2016 | $4,027 | $339,502 | $85,636 | $253,866 |
| 2015 | $3,967 | $334,403 | $84,350 | $250,053 |
| 2014 | $3,895 | $327,853 | $82,698 | $245,155 |
Source: Public Records
Map
Nearby Homes
- 2681 Wrenwood Ave
- 793 Applegate Ave
- 2691 Morris Ave
- 2871 Wrenwood Ave
- 637 Coventry Ave
- 865 McKelvy Ave
- 2549 Purvis Ave
- 2963 Finchwood Ave
- 2337 Wrenwood Ave
- 937 Filbert Ave
- 344 McKelvy Ave
- 2668 Scott Ave
- 603 Kaweah Ave
- 2518 Keats Ave
- 2034 Wrenwood Ave
- 2231 Escalon Ave
- 3154 Mitchell Ave
- 1178 Blackwood Ave
- 2782 Poe Ave
- 3255 Roberts Ave
- 2601 Wrenwood Ave
- 920 Hanson Ave
- 2608 Browning Ave
- 2618 Browning Ave
- 2611 Wrenwood Ave
- 940 Hanson Ave
- 2628 Browning Ave
- 2612 Wrenwood Ave
- 2621 Wrenwood Ave
- 2597 Finchwood Ave
- 960 Hanson Ave
- 872 Hanson Ave
- 2638 Browning Ave
- 2622 Wrenwood Ave
- 2613 Finchwood Ave
- 980 Hanson Ave
- 895 Carolina Ave
- 2648 Browning Ave
- 2632 Wrenwood Ave
- 852 Hanson Ave
Your Personal Tour Guide
Ask me questions while you tour the home.