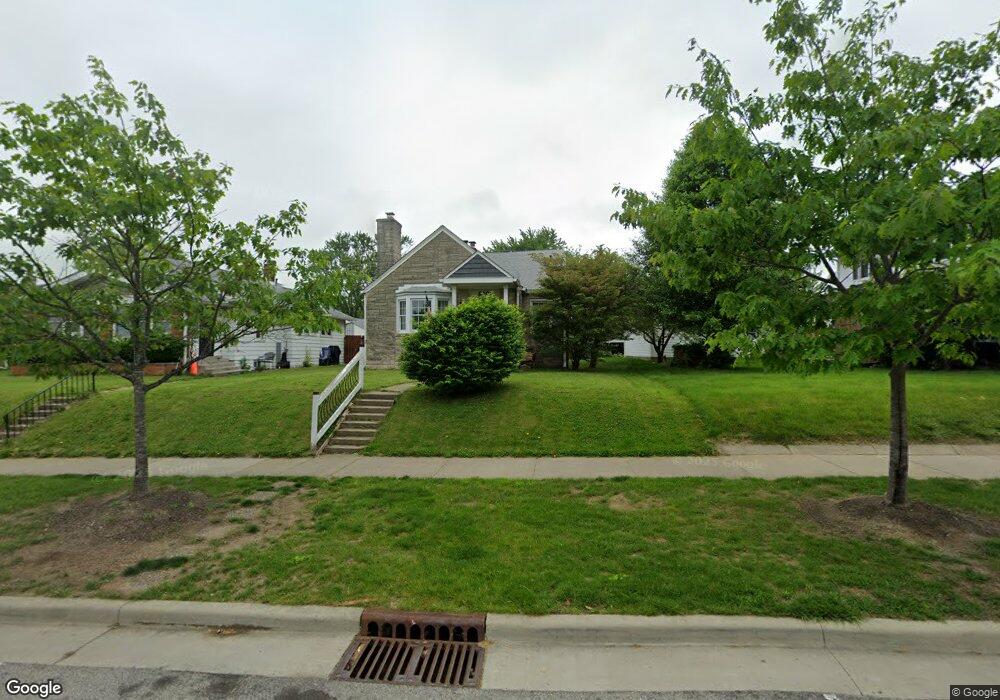
910 Main St Beech Grove, IN 46107
Estimated Value: $220,038 - $296,000
3
Beds
2
Baths
1,501
Sq Ft
$162/Sq Ft
Est. Value
About This Home
This home is located at 910 Main St, Beech Grove, IN 46107 and is currently estimated at $243,760, approximately $162 per square foot. 910 Main St is a home located in Marion County with nearby schools including Hornet Park Elementary School, Central Elementary School, and South Grove Intermediate School.
Ownership History
Date
Name
Owned For
Owner Type
Purchase Details
Closed on
Jan 28, 2016
Sold by
Heffernan David K and Heffernan Teresa C
Bought by
Schmalz Ryan Anthony and Schmalz Ryan
Current Estimated Value
Home Financials for this Owner
Home Financials are based on the most recent Mortgage that was taken out on this home.
Original Mortgage
$132,692
Outstanding Balance
$104,255
Interest Rate
4%
Mortgage Type
VA
Estimated Equity
$139,505
Create a Home Valuation Report for This Property
The Home Valuation Report is an in-depth analysis detailing your home's value as well as a comparison with similar homes in the area
Home Values in the Area
Average Home Value in this Area
Purchase History
| Date | Buyer | Sale Price | Title Company |
|---|---|---|---|
| Schmalz Ryan Anthony | -- | Fidelity National Title |
Source: Public Records
Mortgage History
| Date | Status | Borrower | Loan Amount |
|---|---|---|---|
| Open | Schmalz Ryan Anthony | $132,692 |
Source: Public Records
Tax History
| Year | Tax Paid | Tax Assessment Tax Assessment Total Assessment is a certain percentage of the fair market value that is determined by local assessors to be the total taxable value of land and additions on the property. | Land | Improvement |
|---|---|---|---|---|
| 2025 | $3,189 | $253,700 | $17,500 | $236,200 |
| 2024 | $2,770 | $244,800 | $17,500 | $227,300 |
| 2023 | $2,770 | $216,800 | $17,500 | $199,300 |
| 2022 | $2,619 | $199,500 | $17,500 | $182,000 |
| 2021 | $2,065 | $167,000 | $17,500 | $149,500 |
| 2020 | $1,733 | $149,300 | $17,500 | $131,800 |
| 2019 | $1,639 | $145,100 | $14,400 | $130,700 |
| 2018 | $1,256 | $125,500 | $14,400 | $111,100 |
| 2017 | $1,138 | $123,000 | $14,400 | $108,600 |
| 2016 | $1,078 | $119,100 | $14,400 | $104,700 |
| 2014 | $1,122 | $101,000 | $7,600 | $93,400 |
| 2013 | $970 | $88,400 | $7,600 | $80,800 |
Source: Public Records
Map
Nearby Homes
Your Personal Tour Guide
Ask me questions while you tour the home.