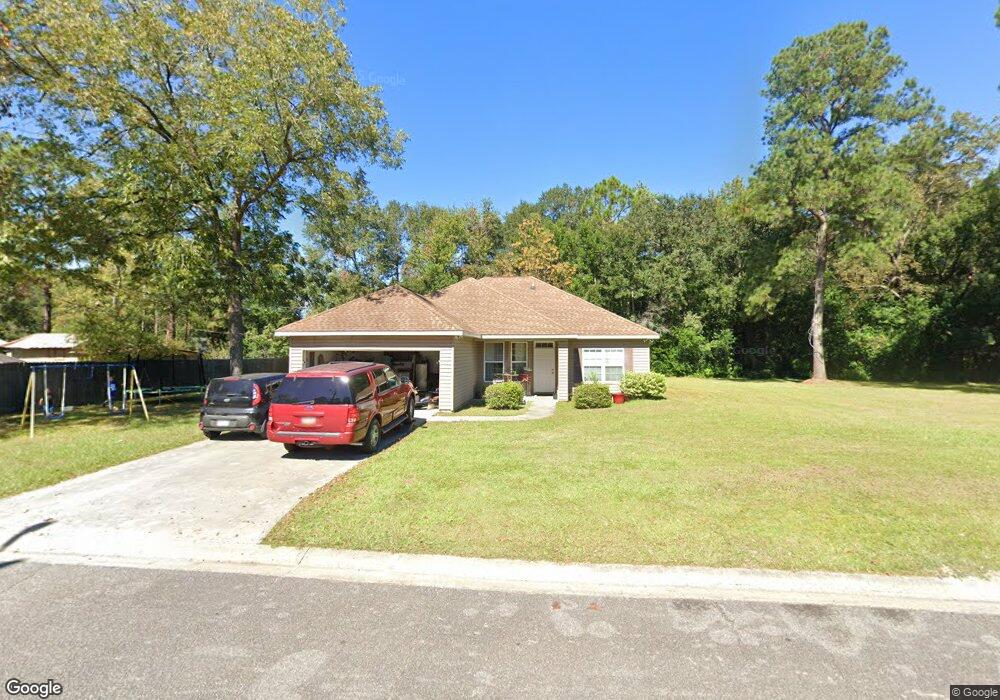
910 Maple St Waycross, GA 31501
Estimated Value: $150,000 - $207,931
3
Beds
2
Baths
1,659
Sq Ft
$111/Sq Ft
Est. Value
About This Home
This home is located at 910 Maple St, Waycross, GA 31501 and is currently estimated at $183,983, approximately $110 per square foot. 910 Maple St is a home located in Ware County with nearby schools including Center Elementary School, Waycross Middle School, and Ware County High School.
Ownership History
Date
Name
Owned For
Owner Type
Purchase Details
Closed on
Oct 26, 2009
Sold by
Cayman Builders Inc
Bought by
Williams Yolanda Leola
Current Estimated Value
Home Financials for this Owner
Home Financials are based on the most recent Mortgage that was taken out on this home.
Original Mortgage
$130,000
Outstanding Balance
$91,643
Interest Rate
5.01%
Mortgage Type
Purchase Money Mortgage
Estimated Equity
$92,340
Purchase Details
Closed on
Oct 6, 2009
Sold by
Cayman Builders Inc
Bought by
Sete Sauda
Home Financials for this Owner
Home Financials are based on the most recent Mortgage that was taken out on this home.
Original Mortgage
$130,000
Outstanding Balance
$91,643
Interest Rate
5.01%
Mortgage Type
Purchase Money Mortgage
Estimated Equity
$92,340
Purchase Details
Closed on
Jul 17, 2009
Sold by
Mckee Robyn
Bought by
Cayman Builders Inc
Purchase Details
Closed on
Feb 25, 2005
Sold by
Hickox Carolyn Jean
Bought by
Mckee Robyn
Create a Home Valuation Report for This Property
The Home Valuation Report is an in-depth analysis detailing your home's value as well as a comparison with similar homes in the area
Purchase History
| Date | Buyer | Sale Price | Title Company |
|---|---|---|---|
| Williams Yolanda Leola | $130,000 | -- | |
| Cayman Builders Inc | -- | -- | |
| Sete Sauda | $6,000 | -- | |
| Cayman Builders Inc | $8,000 | -- | |
| Mckee Robyn | $4,000 | -- |
Source: Public Records
Mortgage History
| Date | Status | Borrower | Loan Amount |
|---|---|---|---|
| Open | Cayman Builders Inc | $130,000 | |
| Closed | Williams Yolanda Leola | $130,000 |
Source: Public Records
Tax History
| Year | Tax Paid | Tax Assessment Tax Assessment Total Assessment is a certain percentage of the fair market value that is determined by local assessors to be the total taxable value of land and additions on the property. | Land | Improvement |
|---|---|---|---|---|
| 2025 | $1,953 | $77,281 | $2,240 | $75,041 |
| 2024 | $1,994 | $84,585 | $2,240 | $82,345 |
| 2023 | $1,994 | $44,725 | $1,434 | $43,291 |
| 2022 | $1,725 | $44,725 | $1,434 | $43,291 |
| 2021 | $1,705 | $40,870 | $1,434 | $39,436 |
| 2020 | $1,685 | $40,119 | $1,434 | $38,685 |
| 2019 | $1,659 | $38,991 | $1,434 | $37,557 |
| 2018 | $1,591 | $37,112 | $1,434 | $35,678 |
| 2017 | $2,014 | $47,684 | $1,434 | $46,250 |
| 2016 | $2,014 | $47,684 | $1,434 | $46,250 |
| 2015 | $2,028 | $47,683 | $1,434 | $46,250 |
| 2014 | $2,026 | $47,684 | $1,434 | $46,250 |
| 2013 | -- | $47,683 | $1,433 | $46,250 |
Source: Public Records
Map
Nearby Homes
- 1509 Bethune St
- 1301 Riverside Ave
- 1410 Hazel St
- 1407 Hazel St
- 0 Beville St
- 1219 Clough St
- 702 E Waring St
- 904 Golfview Dr
- 240 E Blackshear Ave
- 1208 Abner St
- 2109 Neal St
- 1304 McDonald St
- 1110 Jordan St
- 2312 Spurgeon St
- 901 E Waring St
- 109 Hebard St
- 2120 Tebeau St
- 1504 Habersham Dr
- 00 Pioneer St
- 406 Preston St
- 0 Maple St
- 1515 Maple St
- 911 Maple St
- 909 Maple St
- 913 Maple St
- 903 Maple St
- 1708 Dorothy St
- 1801 Toomer St
- 906 Cedar St
- 908 Cedar St
- 904 Cedar St
- 0 Dorothy St Unit 30939
- 0 Dorothy St Unit 26391
- 0 Dorothy St Unit 20304
- 0 Dorothy St Unit 19489
- 0 Dorothy St Unit 19207
- 0 Dorothy St Unit 18262
- 0 Dorothy St Unit 18263
- 0 Dorothy St Unit 33873
- 0 Dorothy St Unit 20024061
Your Personal Tour Guide
Ask me questions while you tour the home.