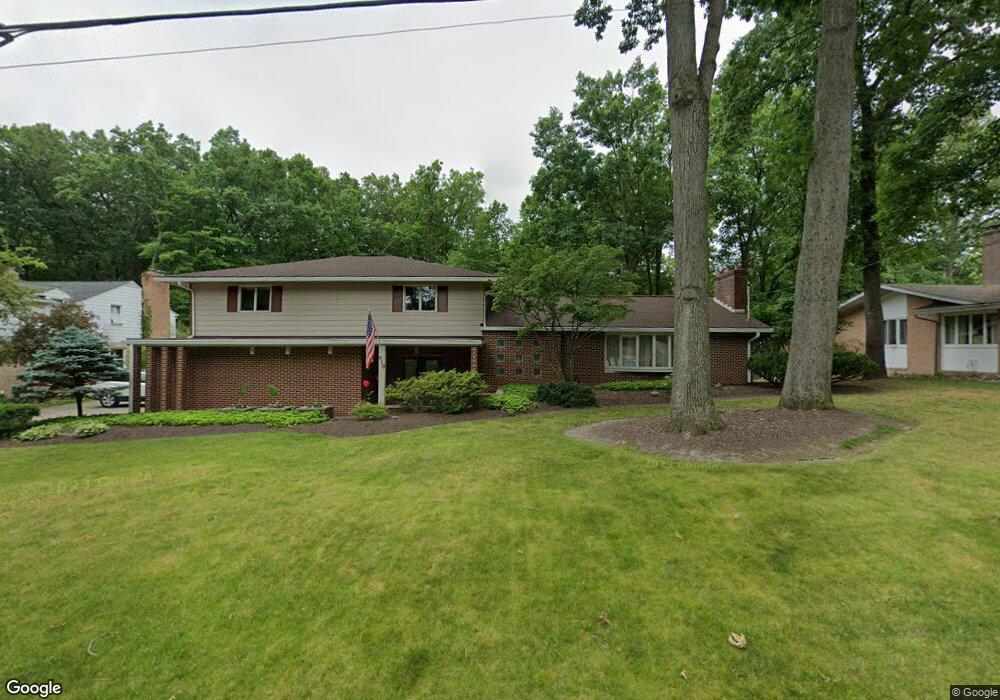
910 Murray Ave Ravenna, OH 44266
Estimated Value: $282,000 - $371,000
4
Beds
3
Baths
3,141
Sq Ft
$102/Sq Ft
Est. Value
About This Home
This home is located at 910 Murray Ave, Ravenna, OH 44266 and is currently estimated at $320,373, approximately $101 per square foot. 910 Murray Ave is a home located in Portage County with nearby schools including West Main Elementary School, West Park Elementary School, and Brown Middle School.
Ownership History
Date
Name
Owned For
Owner Type
Purchase Details
Closed on
May 2, 2009
Sold by
Stewart Mary E
Bought by
Calfee Timothy H and Calfee Susan C
Current Estimated Value
Purchase Details
Closed on
Dec 12, 2008
Sold by
Kane Terrence G P
Bought by
Calfee Timothy H and Calfee Susan C
Purchase Details
Closed on
Aug 12, 2008
Sold by
Kane Joyce M
Bought by
Calfee Timothy H and Calfee Susan C
Purchase Details
Closed on
Jul 17, 2006
Sold by
Calfee Timothy H and Calfee Susan C
Bought by
Calfee Timothy H and Calfee Susan C
Purchase Details
Closed on
Sep 24, 2003
Sold by
Castaldi Barbara and Castaldi Louis
Bought by
Calfee Timothy H and Calfee Susan C
Home Financials for this Owner
Home Financials are based on the most recent Mortgage that was taken out on this home.
Original Mortgage
$155,200
Interest Rate
5.5%
Mortgage Type
Purchase Money Mortgage
Create a Home Valuation Report for This Property
The Home Valuation Report is an in-depth analysis detailing your home's value as well as a comparison with similar homes in the area
Home Values in the Area
Average Home Value in this Area
Purchase History
| Date | Buyer | Sale Price | Title Company |
|---|---|---|---|
| Calfee Timothy H | -- | Attorney | |
| Calfee Timothy H | -- | Accommodation | |
| Calfee Timothy H | -- | Portage Title Agency | |
| Calfee Timothy H | -- | None Available | |
| Calfee Timothy H | $44,000 | Title One |
Source: Public Records
Mortgage History
| Date | Status | Borrower | Loan Amount |
|---|---|---|---|
| Previous Owner | Calfee Timothy H | $155,200 | |
| Closed | Calfee Timothy H | $29,100 |
Source: Public Records
Tax History Compared to Growth
Tax History
| Year | Tax Paid | Tax Assessment Tax Assessment Total Assessment is a certain percentage of the fair market value that is determined by local assessors to be the total taxable value of land and additions on the property. | Land | Improvement |
|---|---|---|---|---|
| 2024 | $3,604 | $98,990 | $10,890 | $88,100 |
| 2023 | $3,075 | $69,200 | $10,890 | $58,310 |
| 2022 | $3,076 | $69,200 | $10,890 | $58,310 |
| 2021 | $3,080 | $69,200 | $10,890 | $58,310 |
| 2020 | $3,303 | $65,910 | $10,890 | $55,020 |
| 2019 | $3,307 | $65,910 | $10,890 | $55,020 |
| 2018 | $3,228 | $60,840 | $13,830 | $47,010 |
| 2017 | $3,228 | $60,840 | $13,830 | $47,010 |
| 2016 | $3,035 | $60,840 | $13,830 | $47,010 |
| 2015 | $3,038 | $60,840 | $13,830 | $47,010 |
| 2014 | $3,035 | $60,840 | $13,830 | $47,010 |
| 2013 | $3,016 | $60,840 | $13,830 | $47,010 |
Source: Public Records
Map
Nearby Homes
- 519 Tappan Ct
- 250 Lawrence St
- 241 Myrtle St
- 451 Pratt St
- 324 Maple St
- 450 S Walnut St
- 377 Maple St
- 159 E Harris Ave
- 6235 Gladys St Unit 4
- 453 S Chestnut St
- 5700 S Prospect St
- 1347 Harding Ave Unit 7A
- 550 Washington Ave
- 415 S Sycamore St
- 471 S Sycamore St
- 242 W Highland Ave
- 502 N Chestnut St
- 0 S Sycamore St
- 452 Mill Rd
- 510 Day St
- 916 Murray Ave
- 904 Murray Ave
- 911 Murray Ave
- 445 Woodland St
- 425 Woodland St
- 774 Murray Ave
- 440 Woodland St
- 423 Woodland St
- 444 Woodland St
- 420 Woodland St
- 956 Murray Ave
- 424 Woodland St
- 415 Woodland St
- 957 Murray Ave
- 0 V L Woodland St
- 766 Murray Ave
- 416 Woodland St
- 441 Liberty St
- 411 Woodland St
- 765 Murray Ave