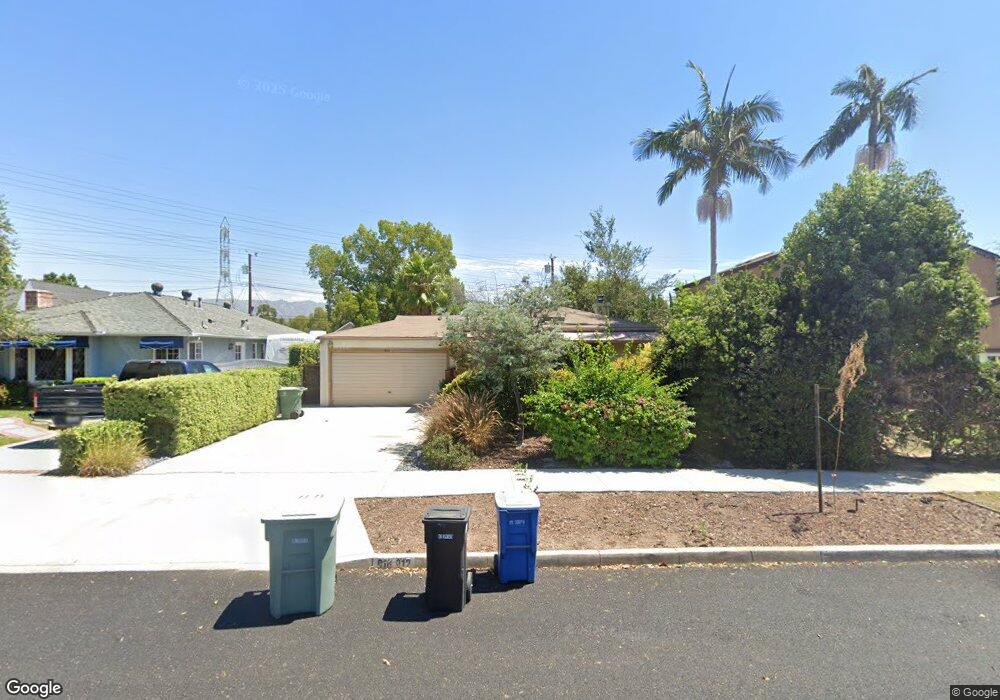
910 N Maple St Burbank, CA 91505
Magnolia Park NeighborhoodEstimated Value: $1,047,000 - $1,615,524
4
Beds
3
Baths
2,300
Sq Ft
$576/Sq Ft
Est. Value
About This Home
This home is located at 910 N Maple St, Burbank, CA 91505 and is currently estimated at $1,324,131, approximately $575 per square foot. 910 N Maple St is a home located in Los Angeles County with nearby schools including Dolores Huerta Middle School, John Burroughs High School, and Toluca Crossroads School.
Ownership History
Date
Name
Owned For
Owner Type
Purchase Details
Closed on
Mar 8, 2016
Sold by
Batista Charles and The Charles Batista Living Tru
Bought by
Guertin Kenneth G
Current Estimated Value
Home Financials for this Owner
Home Financials are based on the most recent Mortgage that was taken out on this home.
Original Mortgage
$576,000
Interest Rate
3.71%
Mortgage Type
New Conventional
Purchase Details
Closed on
May 19, 2005
Sold by
Batista Charles
Bought by
The Charles Batista Living Trust
Home Financials for this Owner
Home Financials are based on the most recent Mortgage that was taken out on this home.
Original Mortgage
$437,500
Interest Rate
4.75%
Mortgage Type
Purchase Money Mortgage
Purchase Details
Closed on
Jan 3, 2003
Sold by
Boyd Dorothy Arlene and Boyd Family Trust
Bought by
Batista Charles
Home Financials for this Owner
Home Financials are based on the most recent Mortgage that was taken out on this home.
Original Mortgage
$386,650
Interest Rate
4.25%
Create a Home Valuation Report for This Property
The Home Valuation Report is an in-depth analysis detailing your home's value as well as a comparison with similar homes in the area
Home Values in the Area
Average Home Value in this Area
Purchase History
| Date | Buyer | Sale Price | Title Company |
|---|---|---|---|
| Guertin Kenneth G | $720,000 | Chicago Title Co | |
| The Charles Batista Living Trust | -- | Security Union Title Insuran | |
| Batista Charles | $407,000 | Equity Title | |
| Batista Charles | $406,363 | Equity Title |
Source: Public Records
Mortgage History
| Date | Status | Borrower | Loan Amount |
|---|---|---|---|
| Previous Owner | Guertin Kenneth G | $576,000 | |
| Previous Owner | The Charles Batista Living Trust | $437,500 | |
| Previous Owner | Batista Charles | $386,650 |
Source: Public Records
Tax History
| Year | Tax Paid | Tax Assessment Tax Assessment Total Assessment is a certain percentage of the fair market value that is determined by local assessors to be the total taxable value of land and additions on the property. | Land | Improvement |
|---|---|---|---|---|
| 2025 | $9,384 | $852,327 | $497,191 | $355,136 |
| 2024 | $9,384 | $835,616 | $487,443 | $348,173 |
| 2023 | $9,283 | $819,233 | $477,886 | $341,347 |
| 2022 | $8,863 | $803,170 | $468,516 | $334,654 |
| 2021 | $8,825 | $787,423 | $459,330 | $328,093 |
| 2020 | $8,727 | $779,350 | $454,621 | $324,729 |
| 2019 | $8,467 | $764,069 | $445,707 | $318,362 |
| 2018 | $8,340 | $749,088 | $436,968 | $312,120 |
| 2016 | $5,494 | $497,943 | $483,266 | $14,677 |
| 2015 | $5,383 | $490,464 | $476,007 | $14,457 |
| 2014 | $5,375 | $480,857 | $466,683 | $14,174 |
Source: Public Records
Map
Nearby Homes
- 821 N Maple St
- 1033 N Pass Ave
- 920 N Ford St
- 1238 N Kenwood St
- 4825 Forman Ave
- 10443 Magnolia Blvd
- 1331 N Evergreen St
- 5108 Strohm Ave
- 10415 Cumpston St
- 4819 Arcola Ave
- 1343 N Whitnall Hwy
- 625 N Niagara St
- 4118 W Kling St
- 1317 N California St
- 4364 W Kling St
- 531 N Niagara St
- 5430 Auckland Ave
- 409 N Avon St
- 4740 Placidia Ave
- 355 N Maple St Unit 203
- 910 912 N Maple St N
- 914 N Maple St
- 908 N Maple St
- 918 N Maple St
- 902 N Maple St
- 911 N Kenwood St
- 915 N Kenwood St
- 907 N Kenwood St
- 922 N Maple St
- 900 N Maple St
- 921 N Kenwood St
- 903 N Kenwood St
- 911 N Maple St
- 926 N Maple St
- 923 N Kenwood St
- 915 N Maple St
- 907 N Maple St
- 859 N Kenwood St
- 859 N Kenwood St Unit B
- 859 N Kenwood St Unit A
Your Personal Tour Guide
Ask me questions while you tour the home.