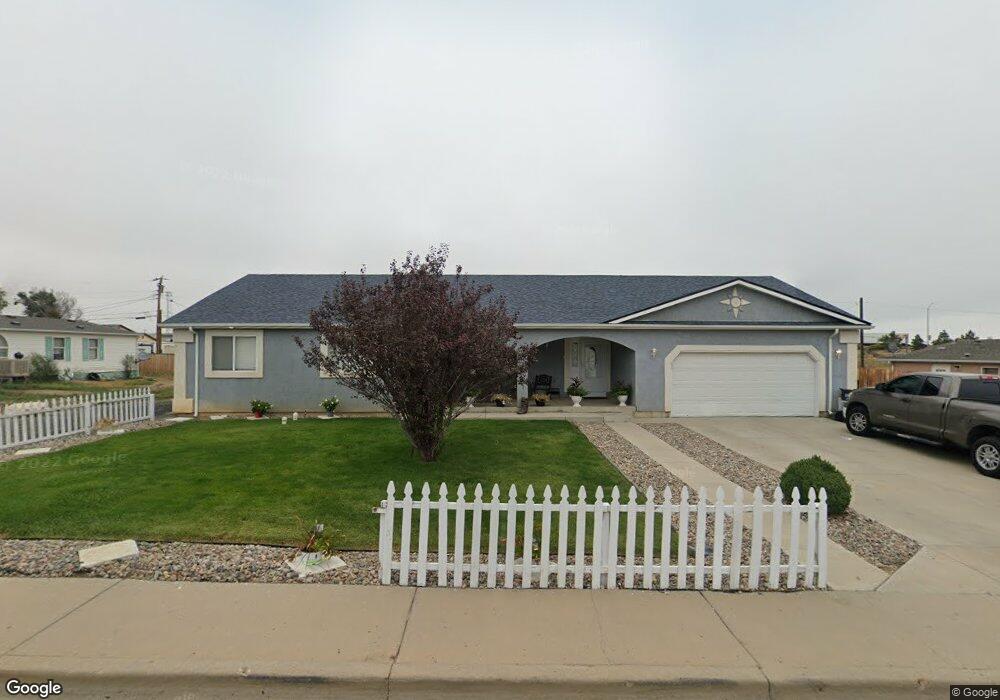
910 N Neilson Ave Pueblo, CO 81001
Eastwood Heights NeighborhoodEstimated Value: $238,000 - $305,000
4
Beds
2
Baths
1,848
Sq Ft
$142/Sq Ft
Est. Value
About This Home
This home is located at 910 N Neilson Ave, Pueblo, CO 81001 and is currently estimated at $262,026, approximately $141 per square foot. 910 N Neilson Ave is a home located in Pueblo County with nearby schools including Baca Elementary School, Heaton Middle School, and East High School.
Ownership History
Date
Name
Owned For
Owner Type
Purchase Details
Closed on
Nov 24, 2006
Sold by
Leal Christina
Bought by
Lean Christina and Lean Levi
Current Estimated Value
Home Financials for this Owner
Home Financials are based on the most recent Mortgage that was taken out on this home.
Original Mortgage
$147,530
Interest Rate
6.3%
Mortgage Type
FHA
Purchase Details
Closed on
Apr 5, 2005
Sold by
Arellano Arlene
Bought by
Leal Christina
Home Financials for this Owner
Home Financials are based on the most recent Mortgage that was taken out on this home.
Original Mortgage
$102,720
Interest Rate
8.84%
Mortgage Type
Fannie Mae Freddie Mac
Purchase Details
Closed on
May 14, 2004
Sold by
Rivera Stanley J
Bought by
Nunez Duane
Purchase Details
Closed on
Jun 6, 1998
Sold by
Leonard Jeanne
Bought by
Rivera Stanley J
Create a Home Valuation Report for This Property
The Home Valuation Report is an in-depth analysis detailing your home's value as well as a comparison with similar homes in the area
Home Values in the Area
Average Home Value in this Area
Purchase History
| Date | Buyer | Sale Price | Title Company |
|---|---|---|---|
| Lean Christina | -- | None Available | |
| Leal Christina | $128,400 | -- | |
| Arellano Arlene | -- | -- | |
| Nunez Duane | $15,000 | -- | |
| Rivera Stanley J | $5,000 | -- |
Source: Public Records
Mortgage History
| Date | Status | Borrower | Loan Amount |
|---|---|---|---|
| Previous Owner | Lean Christina | $147,530 | |
| Previous Owner | Arellano Arlene | $102,720 | |
| Previous Owner | Leal Christina | $25,680 |
Source: Public Records
Tax History Compared to Growth
Tax History
| Year | Tax Paid | Tax Assessment Tax Assessment Total Assessment is a certain percentage of the fair market value that is determined by local assessors to be the total taxable value of land and additions on the property. | Land | Improvement |
|---|---|---|---|---|
| 2024 | $1,062 | $10,810 | -- | -- |
| 2023 | $1,074 | $14,500 | $1,010 | $13,490 |
| 2022 | $1,227 | $12,360 | $670 | $11,690 |
| 2021 | $1,267 | $12,720 | $690 | $12,030 |
| 2020 | $949 | $12,720 | $690 | $12,030 |
| 2019 | $949 | $9,403 | $501 | $8,902 |
| 2018 | $683 | $7,536 | $504 | $7,032 |
| 2017 | $690 | $7,536 | $504 | $7,032 |
| 2016 | $640 | $7,045 | $557 | $6,488 |
| 2015 | $638 | $7,045 | $557 | $6,488 |
| 2014 | $733 | $8,078 | $557 | $7,521 |
Source: Public Records
Map
Nearby Homes
- 2720 E 8th St
- 2801 E 12th St
- 2909 E 4th St
- 0 E 14th St Unit 7407819
- 2729 E 16th St
- 2233 E 8th St Unit 317
- 2114 E 12th St
- 2106 E 8th St
- 2104 E 5th St
- 2008 E 10th St
- 2027 E 14th St
- 2006 E 8th St
- 2018 E 16th St
- TBD 1003 Oakshire Ln
- TBD 002 Oakshire Ln
- 2006 E 14th St
- 1928 E 10th St
- TBD N Salem Ave
- 1938 E 6th St
- 1919 E 12th St
- 2905 E 9th St
- 918 N Neilson Ave
- 915 Fearnow Ave
- 907 N Neilson Ave
- 924 N Neilson Ave
- 0 Neilson Unit 5 78625
- 0 Neilson Unit 127786
- 0 Neilson Unit 127786
- 919 Fearnow Ave
- 2821 E 9th St
- 1002 N Neilson Ave
- 923 Fearnow Ave
- 2819 E 9th St
- 2820 E 10th St
- 1004 N Neilson Ave
- 2817 E 9th St
- 1006 N Neilson Ave
- 1021 Fearnow Ave
- 920 Fearnow Ave
- 2815 E 9th St