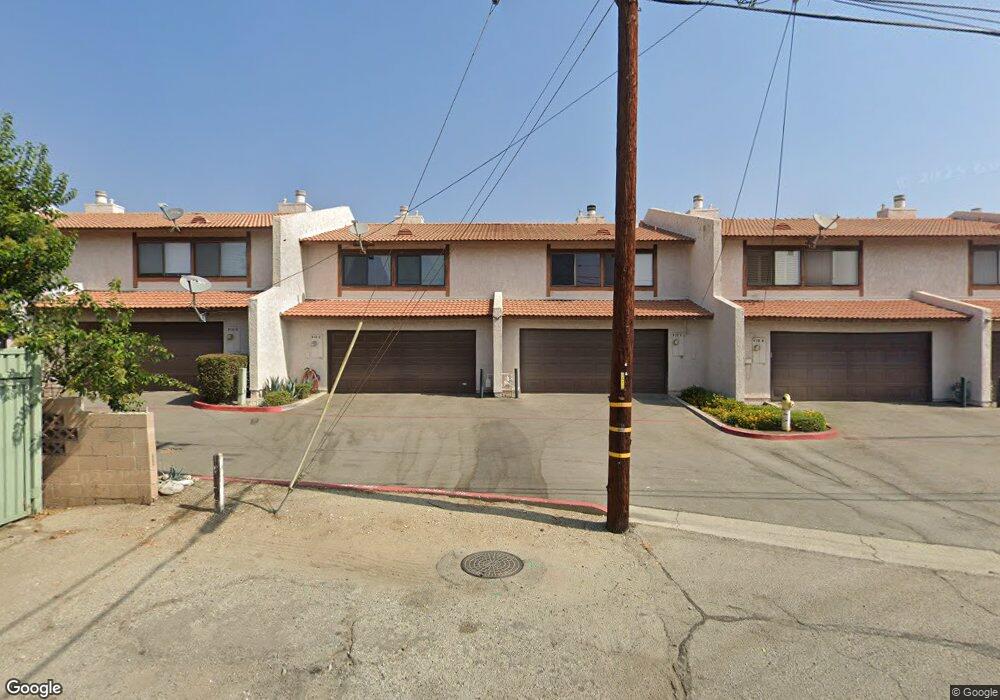
910 N Redding Way Unit B Upland, CA 91786
Estimated Value: $528,000 - $567,000
3
Beds
3
Baths
1,469
Sq Ft
$375/Sq Ft
Est. Value
About This Home
This home is located at 910 N Redding Way Unit B, Upland, CA 91786 and is currently estimated at $550,774, approximately $374 per square foot. 910 N Redding Way Unit B is a home located in San Bernardino County with nearby schools including Baldy View Elementary School, Upland Junior High School, and Upland High School.
Ownership History
Date
Name
Owned For
Owner Type
Purchase Details
Closed on
Aug 28, 2025
Sold by
Angmorter Judith Janet
Bought by
Angmorter Revocable Living Trust and Angmorter
Current Estimated Value
Purchase Details
Closed on
Jan 29, 2007
Sold by
Angmorter Paul
Bought by
Angmorter Judith
Purchase Details
Closed on
Jan 25, 2005
Sold by
Cusimano Benedetto
Bought by
Angmorter Paul and Angmorter Judith
Home Financials for this Owner
Home Financials are based on the most recent Mortgage that was taken out on this home.
Original Mortgage
$254,400
Interest Rate
5.99%
Mortgage Type
Purchase Money Mortgage
Purchase Details
Closed on
Jul 13, 2004
Sold by
Mclaughlan Della
Bought by
Cusimano Benedetto
Home Financials for this Owner
Home Financials are based on the most recent Mortgage that was taken out on this home.
Original Mortgage
$220,000
Interest Rate
6.99%
Mortgage Type
Purchase Money Mortgage
Purchase Details
Closed on
Sep 15, 1994
Sold by
Mammen Katherine J
Bought by
Mammen Steven G
Purchase Details
Closed on
Jun 24, 1994
Sold by
Mammen Steven G
Bought by
Mclaughlan Della
Create a Home Valuation Report for This Property
The Home Valuation Report is an in-depth analysis detailing your home's value as well as a comparison with similar homes in the area
Home Values in the Area
Average Home Value in this Area
Purchase History
| Date | Buyer | Sale Price | Title Company |
|---|---|---|---|
| Angmorter Revocable Living Trust | -- | None Listed On Document | |
| Angmorter Judith | -- | None Available | |
| Angmorter Paul | $318,000 | Chicago Title Company | |
| Cusimano Benedetto | $278,000 | Chicago Title Company | |
| Mammen Steven G | -- | United Title Company | |
| Mclaughlan Della | $1,500 | United Title Company |
Source: Public Records
Mortgage History
| Date | Status | Borrower | Loan Amount |
|---|---|---|---|
| Previous Owner | Angmorter Paul | $254,400 | |
| Previous Owner | Cusimano Benedetto | $220,000 | |
| Closed | Cusimano Benedetto | $41,250 | |
| Closed | Angmorter Paul | $63,600 |
Source: Public Records
Tax History Compared to Growth
Tax History
| Year | Tax Paid | Tax Assessment Tax Assessment Total Assessment is a certain percentage of the fair market value that is determined by local assessors to be the total taxable value of land and additions on the property. | Land | Improvement |
|---|---|---|---|---|
| 2025 | $4,726 | $443,266 | $155,143 | $288,123 |
| 2024 | $4,726 | $434,575 | $152,101 | $282,474 |
| 2023 | $4,653 | $426,054 | $149,119 | $276,935 |
| 2022 | $4,551 | $417,700 | $146,195 | $271,505 |
| 2021 | $4,376 | $394,000 | $138,000 | $256,000 |
| 2020 | $4,053 | $370,900 | $128,800 | $242,100 |
| 2019 | $3,999 | $360,000 | $125,000 | $235,000 |
| 2018 | $3,851 | $348,300 | $121,600 | $226,700 |
| 2017 | $3,601 | $328,600 | $114,700 | $213,900 |
| 2016 | $3,304 | $312,900 | $109,200 | $203,700 |
| 2015 | $3,119 | $298,000 | $104,000 | $194,000 |
| 2014 | $2,834 | $273,000 | $96,000 | $177,000 |
Source: Public Records
Map
Nearby Homes
- 910 N Redding Way Unit F
- 928 N Redding Way Unit D
- 855 N Palm Ave
- 1234 N Laurel Ave
- 691 N 3rd Ave
- 125 Towns Ave
- 0 Bay St Unit AR25093919
- 1346 N Euclid Ave
- 368 West St
- 435 W 9th St Unit F5
- 435 W 9th St Unit B3
- 922 N 4th Ave
- 952 N 4th Ave
- 1188 N 3rd Ave
- 939 W Pine St Unit 44
- 537 W 9th St
- 506 E 11th St
- 1404 N Euclid Ave
- 1361 N 3rd Ave
- 609 N 6th Ave
- 910 N Redding Way Unit A
- 910 N Redding Way Unit H
- 910 N Redding Way Unit I
- 910 N Redding Way Unit E
- 910 N Redding Way
- 910 N Redding Way
- 910 N Redding Way Unit 12
- 910 N Redding Way
- 910 N Redding Way Unit 8
- 910 N Redding Way Unit 16
- 910 N Redding Way
- 910 N Redding Way Unit C
- 912 N Redding Way Unit D
- 912 N Redding Way Unit B
- 912 N Redding Way Unit 36
- 912 N Redding Way
- 912 N Redding Way
- 912 N Redding Way Unit C
- 930 N Redding Way Unit F
- 930 N Redding Way Unit G