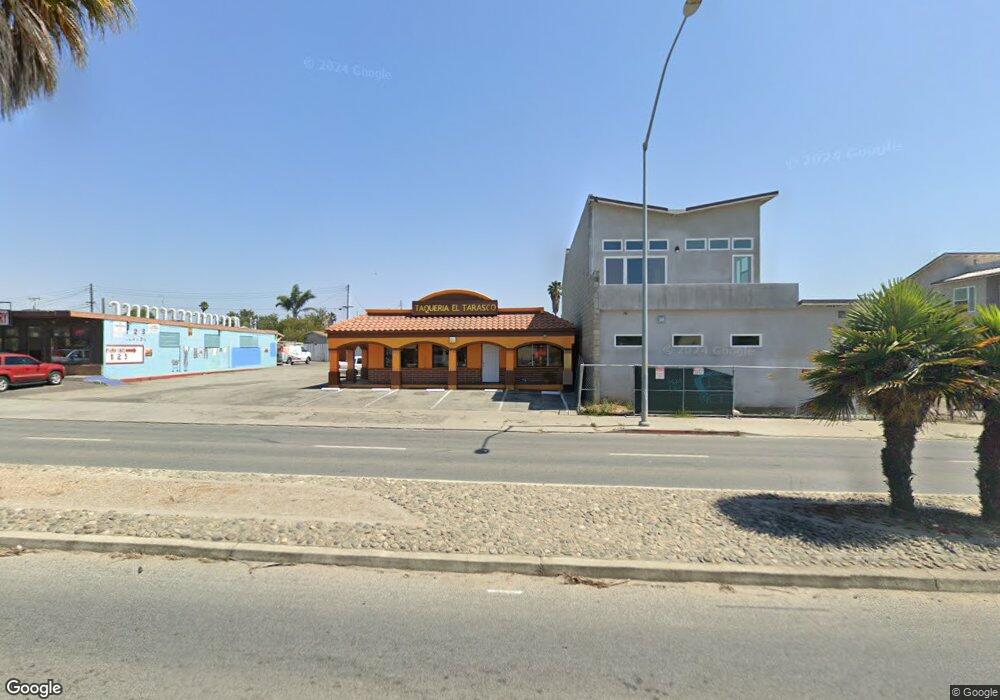
910 N Sanborn Rd Salinas, CA 93905
East Salinas NeighborhoodEstimated Value: $987,175
Studio
2
Baths
972
Sq Ft
$1,016/Sq Ft
Est. Value
About This Home
This home is located at 910 N Sanborn Rd, Salinas, CA 93905 and is currently estimated at $987,175, approximately $1,015 per square foot. 910 N Sanborn Rd is a home located in Monterey County with nearby schools including Dr. Martin Luther King, Jr. Academy, El Sausal Middle School, and Alisal High School.
Ownership History
Date
Name
Owned For
Owner Type
Purchase Details
Closed on
Dec 10, 2013
Sold by
Campos Raul and Campos Fabiola
Bought by
Potro Llc
Current Estimated Value
Purchase Details
Closed on
Aug 23, 2012
Sold by
The York F Gin Family Partnership
Bought by
Campos Raul and Campos Fabiola
Home Financials for this Owner
Home Financials are based on the most recent Mortgage that was taken out on this home.
Original Mortgage
$250,000
Interest Rate
3.58%
Mortgage Type
Commercial
Create a Home Valuation Report for This Property
The Home Valuation Report is an in-depth analysis detailing your home's value as well as a comparison with similar homes in the area
Home Values in the Area
Average Home Value in this Area
Purchase History
| Date | Buyer | Sale Price | Title Company |
|---|---|---|---|
| Potro Llc | -- | None Available | |
| Campos Raul | $350,000 | Chicago Title Company |
Source: Public Records
Mortgage History
| Date | Status | Borrower | Loan Amount |
|---|---|---|---|
| Previous Owner | Campos Raul | $250,000 |
Source: Public Records
Tax History
| Year | Tax Paid | Tax Assessment Tax Assessment Total Assessment is a certain percentage of the fair market value that is determined by local assessors to be the total taxable value of land and additions on the property. | Land | Improvement |
|---|---|---|---|---|
| 2025 | $6,796 | $430,986 | $166,235 | $264,751 |
| 2024 | $6,796 | $422,536 | $162,976 | $259,560 |
| 2023 | $6,587 | $414,252 | $159,781 | $254,471 |
| 2022 | $5,856 | $406,131 | $156,649 | $249,482 |
| 2021 | $5,736 | $398,169 | $153,578 | $244,591 |
| 2020 | $5,858 | $394,088 | $152,004 | $242,084 |
| 2019 | $6,024 | $386,362 | $149,024 | $237,338 |
| 2018 | $5,090 | $378,787 | $146,102 | $232,685 |
| 2017 | $5,900 | $371,361 | $143,238 | $228,123 |
| 2016 | $5,612 | $364,080 | $140,430 | $223,650 |
| 2015 | $5,523 | $358,612 | $138,321 | $220,291 |
| 2014 | $5,257 | $351,588 | $135,612 | $215,976 |
Source: Public Records
Map
Nearby Homes
- 933 Acosta Plaza Unit 35
- 948 Rider Ave
- 1126 Pacific Ave
- 11 E Laurel Dr
- 11 Hill Cir
- 1046 C St
- 609 Saint George Dr
- 755 Pino Way
- 544 Saint George Dr
- 11 Fresa Place
- 320 N Sanborn Rd
- 724 Circle Dr
- 230 Paloma Ave
- 129 N Filice St
- 18 Hancock Cir
- 78 Ragsdale Ct
- 83 Beverly Dr
- 1544 Saguaro Dr Unit 4
- 150 Kern St Unit 114
- 1725 Great Island St
Your Personal Tour Guide
Ask me questions while you tour the home.