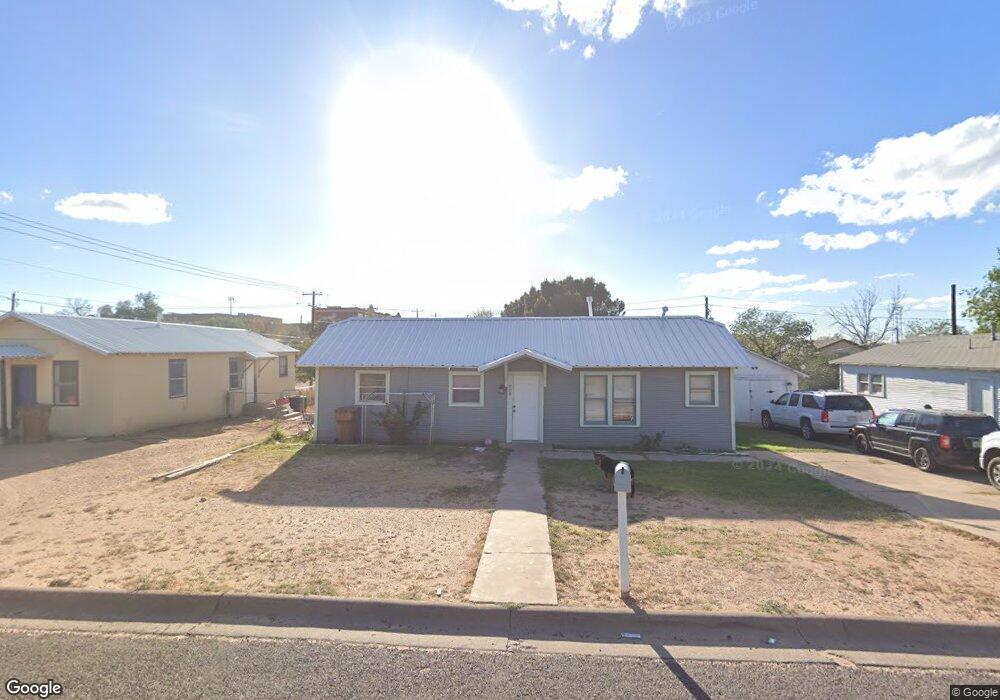
910 Nolan St Big Spring, TX 79720
Estimated Value: $118,000 - $181,000
Studio
--
Bath
3,100
Sq Ft
$47/Sq Ft
Est. Value
About This Home
This home is located at 910 Nolan St, Big Spring, TX 79720 and is currently estimated at $145,279, approximately $46 per square foot. 910 Nolan St is a home located in Howard County with nearby schools including Big Spring High School, St. Mary's Episcopal School, and Nazarene Christian Academy Big Spring.
Ownership History
Date
Name
Owned For
Owner Type
Purchase Details
Closed on
Oct 9, 2018
Sold by
Doe Bobby and Doe Ronda
Bought by
Neagle Bruce
Current Estimated Value
Create a Home Valuation Report for This Property
The Home Valuation Report is an in-depth analysis detailing your home's value as well as a comparison with similar homes in the area
Purchase History
| Date | Buyer | Sale Price | Title Company |
|---|---|---|---|
| Neagle Bruce | -- | Surety Title Company |
Source: Public Records
Tax History
| Year | Tax Paid | Tax Assessment Tax Assessment Total Assessment is a certain percentage of the fair market value that is determined by local assessors to be the total taxable value of land and additions on the property. | Land | Improvement |
|---|---|---|---|---|
| 2025 | $1,442 | $73,957 | $7,873 | $66,084 |
| 2024 | $1,316 | $73,957 | $7,873 | $66,084 |
| 2023 | $1,481 | $84,042 | $6,125 | $77,917 |
| 2022 | $1,486 | $72,785 | $4,900 | $67,885 |
| 2021 | $1,773 | $75,439 | $4,900 | $70,539 |
| 2019 | $1,720 | $67,988 | $4,900 | $63,088 |
| 2018 | $2,088 | $69,693 | $4,900 | $64,793 |
| 2017 | $2,076 | $70,540 | $4,900 | $65,640 |
| 2016 | $2,126 | $72,223 | $4,900 | $67,323 |
| 2015 | -- | $74,448 | $4,900 | $69,548 |
| 2014 | -- | $19,523 | $2,100 | $17,423 |
Source: Public Records
Map
Nearby Homes
- 108 E 11th Place
- 1202 Runnels St
- 1009 Scurry St
- 1011 Scurry St
- 605 E 12th St
- 502 E 12th St
- 1405 Nolan St
- 501 E 15th St
- 607 E 15th St
- 602 Caylor Dr
- 600 Caylor Dr
- TBD Campestre Estates
- 214 Peterson
- 25 Village at the Spring Unit J
- 00 N Tbd
- 1100 Martin
- 601 Caylor Dr
- 1005 Bluebonnet Ave
- 1010 Sycamore St
- 1407 Owens St
Your Personal Tour Guide
Ask me questions while you tour the home.