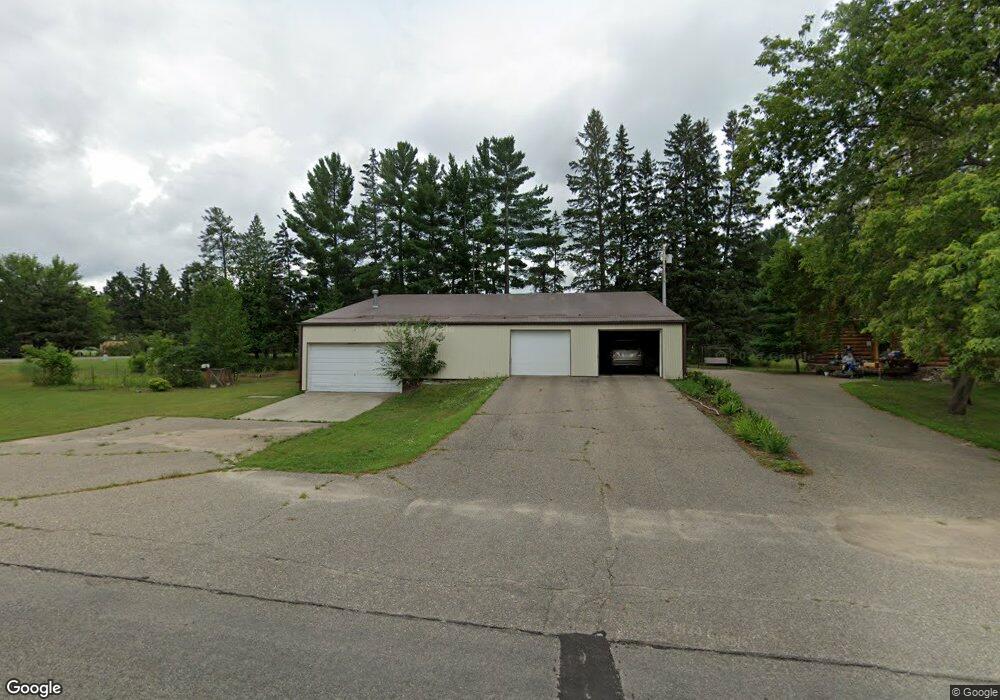
910 Pine St Park Rapids, MN 56470
Estimated Value: $234,000 - $279,917
3
Beds
3
Baths
1,936
Sq Ft
$136/Sq Ft
Est. Value
About This Home
This home is located at 910 Pine St, Park Rapids, MN 56470 and is currently estimated at $262,479, approximately $135 per square foot. 910 Pine St is a home located in Hubbard County with nearby schools including Century Elementary School, Century School, and Park Rapids Area High School.
Ownership History
Date
Name
Owned For
Owner Type
Purchase Details
Closed on
Nov 24, 2021
Sold by
Fritsch Katherine and Bergquist Kurt
Bought by
Hedlund Laura M and Hedlund Jamie L
Current Estimated Value
Home Financials for this Owner
Home Financials are based on the most recent Mortgage that was taken out on this home.
Original Mortgage
$192,261
Outstanding Balance
$176,806
Interest Rate
3.1%
Estimated Equity
$85,673
Purchase Details
Closed on
May 30, 2017
Sold by
Barnett James B and Barnett Shannon M
Bought by
Fritsch Katherine
Home Financials for this Owner
Home Financials are based on the most recent Mortgage that was taken out on this home.
Original Mortgage
$123,905
Interest Rate
4.02%
Mortgage Type
Purchase Money Mortgage
Purchase Details
Closed on
Jan 9, 2007
Sold by
Harmon Michael Lee and Larson Manya B
Bought by
Barnett James B and Barnett Shannon M
Home Financials for this Owner
Home Financials are based on the most recent Mortgage that was taken out on this home.
Original Mortgage
$135,200
Interest Rate
6.21%
Mortgage Type
New Conventional
Create a Home Valuation Report for This Property
The Home Valuation Report is an in-depth analysis detailing your home's value as well as a comparison with similar homes in the area
Home Values in the Area
Average Home Value in this Area
Purchase History
| Date | Buyer | Sale Price | Title Company |
|---|---|---|---|
| Hedlund Laura M | $198,900 | None Available | |
| Fritsch Katherine | $155,000 | None Available | |
| Barnett James B | $169,000 | None Available |
Source: Public Records
Mortgage History
| Date | Status | Borrower | Loan Amount |
|---|---|---|---|
| Open | Hedlund Laura M | $192,261 | |
| Previous Owner | Fritsch Katherine | $123,905 | |
| Previous Owner | Barnett James B | $135,200 |
Source: Public Records
Tax History
| Year | Tax Paid | Tax Assessment Tax Assessment Total Assessment is a certain percentage of the fair market value that is determined by local assessors to be the total taxable value of land and additions on the property. | Land | Improvement |
|---|---|---|---|---|
| 2024 | $3,022 | $250,000 | $24,600 | $225,400 |
| 2023 | $3,220 | $256,500 | $22,300 | $234,200 |
| 2022 | $2,660 | $242,300 | $22,300 | $220,000 |
| 2021 | $2,492 | $193,300 | $22,300 | $171,000 |
| 2020 | $2,508 | $162,800 | $22,269 | $140,531 |
| 2019 | $2,184 | $158,100 | $22,145 | $135,955 |
| 2018 | $2,300 | $145,300 | $18,737 | $126,563 |
| 2016 | $2,054 | $136,100 | $18,489 | $117,611 |
| 2015 | $1,732 | $119,200 | $17,942 | $101,258 |
| 2014 | $1,824 | $125,100 | $21,088 | $104,012 |
Source: Public Records
Map
Nearby Homes
- 809 Pine St
- 300 Central Ave S
- ABC Henrietta Ave
- 16008 Discovery Cir
- Lot 17 Discovery Cir
- Lot 16 Discovery Cir
- 800 Forest Ave
- 107 Grove Ave N
- 707 Bridge St
- XXX First St E (Hwy 34)
- 31282 U S Highway 71
- xxx 170th St
- 900 Pleasant Ave S
- 1008 Sunrise Cir
- 503 Lake Ave
- 806 Central Ave N
- 716 Park Ave N Unit 3
- 603 7th St W
- 900 Park Ave N Unit 5
- 18303 County 4
- 403 Eastern Ave S
- 403 Eastern Ave S
- 911 Pine St
- 909 Pine St
- 311 Eastern Ave S
- 905 Pine St
- 501 Eastern Ave S
- 907 Pine St
- 904 Cutler St
- 309 Eastern Ave S
- 402 Eastern Ave S
- 903 Pine St
- 307 Eastern Ave S
- 306 Eastern Ave S
- 500 Eastern Ave S
- 308 Eastern Ave S
- 905 South St
- 401 Birch Ave
- 502 Eastern Ave S
- 303 Eastern Ave S
Your Personal Tour Guide
Ask me questions while you tour the home.