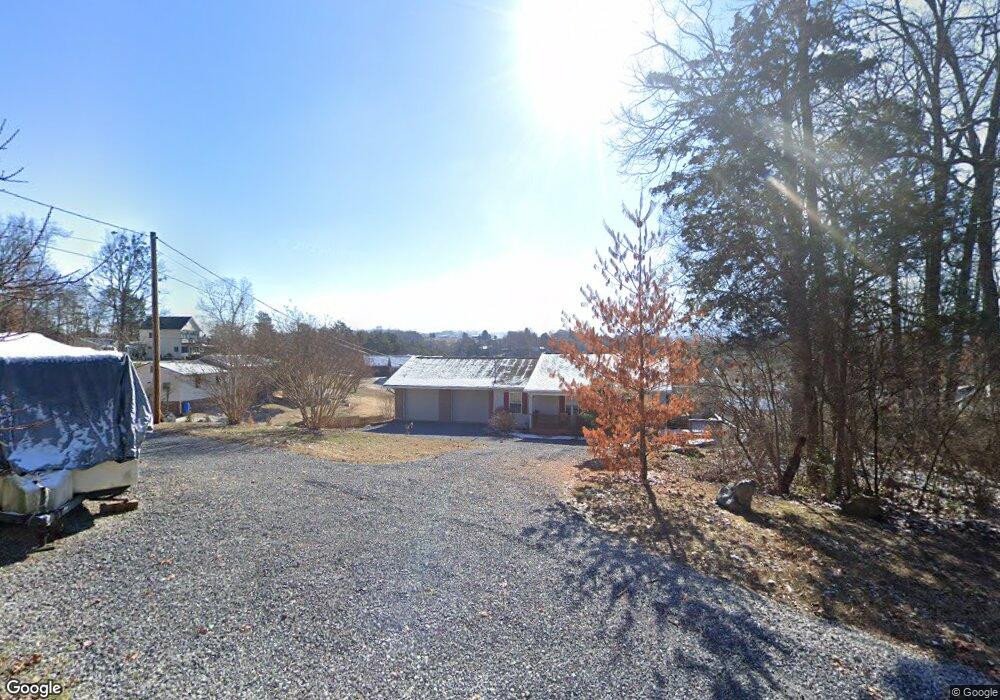
910 Puzzle Dr Dandridge, TN 37725
Estimated Value: $598,000 - $794,000
3
Beds
3
Baths
2,363
Sq Ft
$288/Sq Ft
Est. Value
About This Home
This home is located at 910 Puzzle Dr, Dandridge, TN 37725 and is currently estimated at $679,424, approximately $287 per square foot. 910 Puzzle Dr is a home located in Jefferson County with nearby schools including Mountain View Academy For Young Men.
Ownership History
Date
Name
Owned For
Owner Type
Purchase Details
Closed on
Jun 24, 2011
Sold by
Tamecki Mark J
Bought by
Tamecki Mark J and Tamecki Bozenna E
Current Estimated Value
Home Financials for this Owner
Home Financials are based on the most recent Mortgage that was taken out on this home.
Original Mortgage
$145,000
Outstanding Balance
$99,913
Interest Rate
4.62%
Mortgage Type
Commercial
Estimated Equity
$579,511
Purchase Details
Closed on
Jul 21, 2006
Sold by
Timothy Masters Edward
Bought by
Sutton Jerry W
Home Financials for this Owner
Home Financials are based on the most recent Mortgage that was taken out on this home.
Original Mortgage
$258,000
Interest Rate
6.68%
Purchase Details
Closed on
Aug 26, 1999
Sold by
Tony Brewer
Bought by
Edward Masters
Purchase Details
Closed on
Dec 28, 1998
Sold by
Tony Brewer and Tony Sheila
Bought by
Tony Brewer
Purchase Details
Closed on
Jan 1, 1981
Bought by
Zerbe Donald D and Zerbe Beulah I
Purchase Details
Closed on
Oct 31, 1978
Purchase Details
Closed on
Jan 1, 1978
Purchase Details
Closed on
Nov 1, 1974
Create a Home Valuation Report for This Property
The Home Valuation Report is an in-depth analysis detailing your home's value as well as a comparison with similar homes in the area
Home Values in the Area
Average Home Value in this Area
Purchase History
| Date | Buyer | Sale Price | Title Company |
|---|---|---|---|
| Tamecki Mark J | -- | -- | |
| Tamecki Mary J | $285,000 | -- | |
| Sutton Jerry W | $304,000 | -- | |
| Edward Masters | $150,000 | -- | |
| Tony Brewer | $35,000 | -- | |
| Zerbe Donald D | $30,000 | -- | |
| -- | -- | -- | |
| -- | $26,500 | -- | |
| -- | -- | -- |
Source: Public Records
Mortgage History
| Date | Status | Borrower | Loan Amount |
|---|---|---|---|
| Open | Tamecki Mary J | $145,000 | |
| Closed | Tamecki Mark J | $145,000 | |
| Previous Owner | Not Available | $258,000 |
Source: Public Records
Tax History
| Year | Tax Paid | Tax Assessment Tax Assessment Total Assessment is a certain percentage of the fair market value that is determined by local assessors to be the total taxable value of land and additions on the property. | Land | Improvement |
|---|---|---|---|---|
| 2025 | $2,065 | $144,375 | $50,000 | $94,375 |
| 2023 | $1,940 | $84,350 | $0 | $0 |
| 2022 | $1,847 | $84,350 | $36,250 | $48,100 |
| 2021 | $1,847 | $84,350 | $36,250 | $48,100 |
| 2020 | $1,847 | $84,350 | $36,250 | $48,100 |
| 2019 | $1,847 | $84,350 | $36,250 | $48,100 |
| 2018 | $1,787 | $76,025 | $36,250 | $39,775 |
| 2017 | $1,787 | $76,025 | $36,250 | $39,775 |
| 2016 | $1,787 | $76,025 | $36,250 | $39,775 |
| 2015 | $1,787 | $76,025 | $36,250 | $39,775 |
| 2014 | $1,787 | $76,025 | $36,250 | $39,775 |
Source: Public Records
Map
Nearby Homes
- 412 George Washington Dr
- 983 Lake Ridge Dr
- Lot 5 Riley Rd
- 219 Sullivan Point
- 1116 Lake Ridge Dr
- 1267 Lakeview Dr
- 103 Indian Shores Overlook
- 0 E Meeting St
- 1 E Meeting St
- 929 Black Alder Ln
- 1124 Carolina Dr
- 0 Beechwood Dr Unit 1262622
- 1712 Goddard Ln
- 978 Beechwood Dr
- 1700 Goddard Ln
- 318 E Meeting St
- 322 Battlefield Dr
- 340 Battlefield Dr
- 1241 Faith Ln
- 917 Nichols Rd
- 909 Overview Dr
- 811 Plainview Dr
- 920 Puzzle Dr
- 817 Plainview Dr
- 911 Overview Dr
- 910 Overview Dr
- 821 Plainview Dr
- 810 Plainview Dr
- 902 Overview Dr
- 825 Plainview Dr
- 816 Plainview Dr
- 822 Plainview Dr
- 920 Overview Dr
- 800 Plainview Dr
- 829 Plainview Dr
- 826 Plainview Dr
- 830 Plainview Dr
- 0 Plainview Dr
- 751 Plainview Dr
- 834 Plainview Dr
Your Personal Tour Guide
Ask me questions while you tour the home.