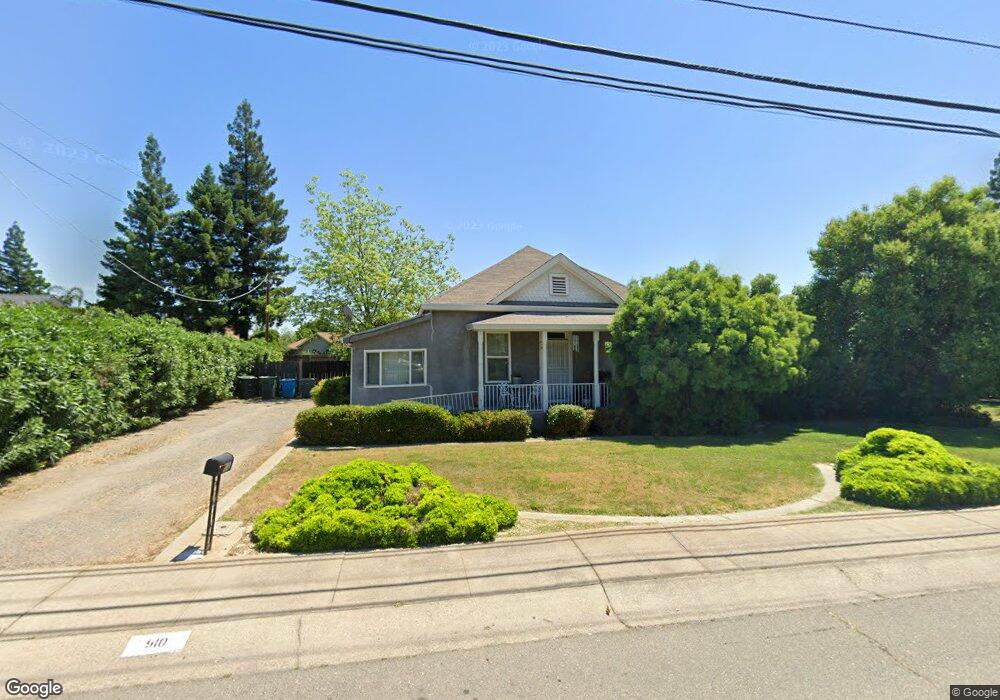
910 Railroad Ave Yuba City, CA 95991
Estimated Value: $351,000 - $389,000
3
Beds
2
Baths
1,204
Sq Ft
$306/Sq Ft
Est. Value
About This Home
This home is located at 910 Railroad Ave, Yuba City, CA 95991 and is currently estimated at $368,160, approximately $305 per square foot. 910 Railroad Ave is a home located in Sutter County with nearby schools including Lincrest Elementary School, Yuba City High School, and Yuba City Charter School.
Ownership History
Date
Name
Owned For
Owner Type
Purchase Details
Closed on
Feb 2, 2010
Sold by
Jeffrey T Helm Inc
Bought by
Curran Kathleen G
Current Estimated Value
Home Financials for this Owner
Home Financials are based on the most recent Mortgage that was taken out on this home.
Original Mortgage
$112,000
Outstanding Balance
$73,539
Interest Rate
5.03%
Mortgage Type
New Conventional
Estimated Equity
$294,621
Purchase Details
Closed on
Nov 3, 2009
Sold by
Garcia Eris and Pureco Heriberto
Bought by
Jeffrey T Helm Inc
Purchase Details
Closed on
Aug 14, 2006
Sold by
Speckert Otto and Speckert Barbara
Bought by
Pureco Heriberto and Garcia Eris
Home Financials for this Owner
Home Financials are based on the most recent Mortgage that was taken out on this home.
Original Mortgage
$278,000
Interest Rate
9.15%
Mortgage Type
Balloon
Purchase Details
Closed on
Aug 5, 2005
Sold by
Karneges Penelope
Bought by
Speckert Otto and Speckert Barbara
Create a Home Valuation Report for This Property
The Home Valuation Report is an in-depth analysis detailing your home's value as well as a comparison with similar homes in the area
Purchase History
| Date | Buyer | Sale Price | Title Company |
|---|---|---|---|
| Curran Kathleen G | $140,000 | Placer Title Company | |
| Jeffrey T Helm Inc | $81,200 | Fidelity Natl Title Ins Co | |
| Pureco Heriberto | $278,000 | North State Title Company | |
| Speckert Otto | $203,000 | North State Title Company |
Source: Public Records
Mortgage History
| Date | Status | Borrower | Loan Amount |
|---|---|---|---|
| Open | Curran Kathleen G | $112,000 | |
| Previous Owner | Pureco Heriberto | $278,000 |
Source: Public Records
Tax History
| Year | Tax Paid | Tax Assessment Tax Assessment Total Assessment is a certain percentage of the fair market value that is determined by local assessors to be the total taxable value of land and additions on the property. | Land | Improvement |
|---|---|---|---|---|
| 2025 | $2,000 | $180,698 | $64,533 | $116,165 |
| 2024 | $2,000 | $177,156 | $63,268 | $113,888 |
| 2023 | $2,000 | $173,683 | $62,028 | $111,655 |
| 2022 | $1,931 | $170,278 | $60,812 | $109,466 |
| 2021 | $1,909 | $166,953 | $59,626 | $107,327 |
| 2020 | $1,875 | $165,241 | $59,015 | $106,226 |
| 2019 | $1,834 | $162,002 | $57,858 | $104,144 |
| 2018 | $1,807 | $158,824 | $56,723 | $102,101 |
| 2017 | $1,762 | $155,711 | $55,611 | $100,100 |
| 2016 | $1,727 | $152,658 | $54,521 | $98,137 |
Source: Public Records
Map
Nearby Homes
- 934 Eastcrest Ct
- 750 Lincoln Rd Unit 17
- 750 Lincoln Rd Unit 82
- 750 Lincoln Rd Unit 58
- 930 Jones Rd
- 1098 Gilliland Dr
- 1220 Rickey Dr
- 1061 Courtyard Dr
- 1224 Highland Ave
- 528 Queensbury Way
- 3140 Railroad Ave
- 998 Mariposa Dr
- 1222 Hillcrest Ave
- 1119 John Wayne Dr
- 1005 Hillcrest Ave
- 764 Scirocco Dr
- 1379 Zephyr Dr
- 95 Orchard St
- 1404 Tradewind Dr
- 1099 Hunn Rd
- 920 Railroad Ave
- 900 Railroad Ave
- 750 Gee Bee Way
- 731 Katherine Ct
- 761 Gee Bee Way
- 901 Railroad Ave
- 930 Railroad Ave
- 730 Katherine Ct
- 802 Kelli Dr
- 721 Katherine Ct
- 740 Gee Bee Way
- 815 Kelli Dr
- 890 Railroad Ave
- 704 Andrew Dr
- 940 Railroad Ave
- 816 Kelli Dr
- 931 Railroad Ave
- 720 Katherine Ct
- 710 Andrew Dr
- 741 Gee Bee Way
Your Personal Tour Guide
Ask me questions while you tour the home.