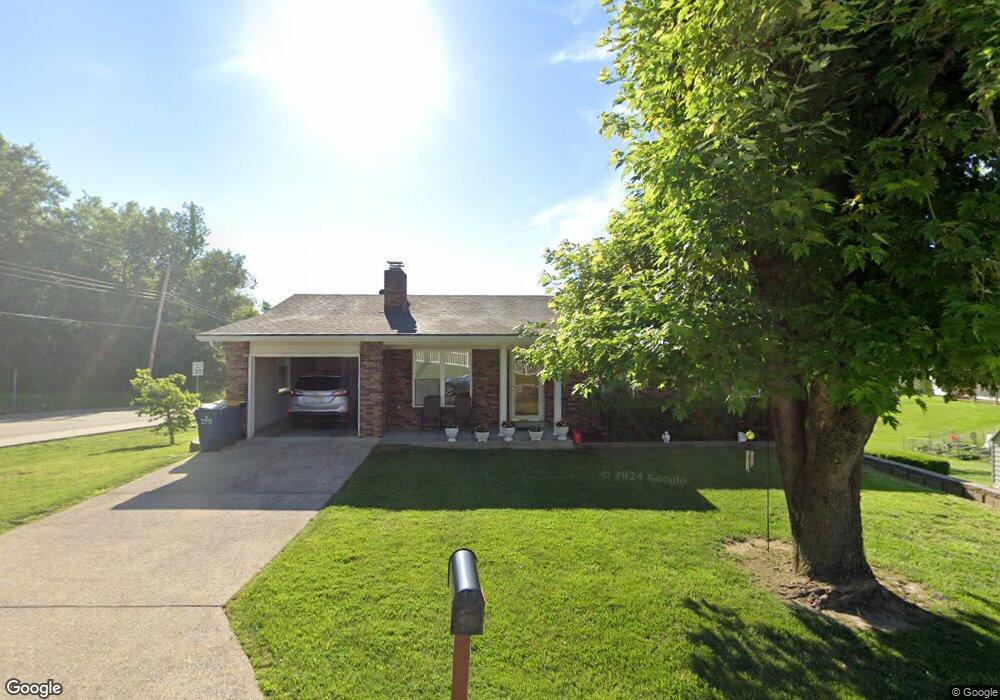
910 Richard Ave Festus, MO 63028
Festus/Crystal City NeighborhoodEstimated Value: $221,000 - $344,000
--
Bed
1
Bath
1,352
Sq Ft
$202/Sq Ft
Est. Value
About This Home
This home is located at 910 Richard Ave, Festus, MO 63028 and is currently estimated at $272,722, approximately $201 per square foot. 910 Richard Ave is a home located in Jefferson County with nearby schools including Festus Elementary School, Festus Intermediate School, and Festus Middle School.
Ownership History
Date
Name
Owned For
Owner Type
Purchase Details
Closed on
Oct 4, 2023
Sold by
Olinger Michael Louis
Bought by
Olinger Michael L and Olinger Nancy J
Current Estimated Value
Purchase Details
Closed on
Nov 4, 2019
Sold by
Olinger Michael Louis and Olinger Nancy J
Bought by
Olinger Michael John
Purchase Details
Closed on
Feb 25, 2013
Sold by
Olinger Michael L
Bought by
Olinger Michael L and Olinger Nancy J
Purchase Details
Closed on
Dec 19, 2012
Sold by
Siebert Russell J and Siebert Deborah C
Bought by
Burt Charles A and Burt Kimberly A
Home Financials for this Owner
Home Financials are based on the most recent Mortgage that was taken out on this home.
Original Mortgage
$115,000
Interest Rate
3.42%
Mortgage Type
Purchase Money Mortgage
Purchase Details
Closed on
Jul 22, 1999
Sold by
Olinger Mike L and Olinger Nancy J
Bought by
Olinger Mike J
Create a Home Valuation Report for This Property
The Home Valuation Report is an in-depth analysis detailing your home's value as well as a comparison with similar homes in the area
Home Values in the Area
Average Home Value in this Area
Purchase History
| Date | Buyer | Sale Price | Title Company |
|---|---|---|---|
| Olinger Michael L | -- | None Listed On Document | |
| Olinger Michael John | -- | None Available | |
| Olinger Michael L | -- | None Available | |
| Burt Charles A | -- | None Available | |
| Olinger Mike J | -- | -- |
Source: Public Records
Mortgage History
| Date | Status | Borrower | Loan Amount |
|---|---|---|---|
| Previous Owner | Burt Charles A | $115,000 |
Source: Public Records
Tax History Compared to Growth
Tax History
| Year | Tax Paid | Tax Assessment Tax Assessment Total Assessment is a certain percentage of the fair market value that is determined by local assessors to be the total taxable value of land and additions on the property. | Land | Improvement |
|---|---|---|---|---|
| 2025 | $1,127 | $21,200 | $1,100 | $20,100 |
| 2024 | $1,127 | $19,900 | $1,100 | $18,800 |
| 2023 | $1,127 | $19,900 | $1,100 | $18,800 |
| 2022 | $1,121 | $19,900 | $1,100 | $18,800 |
| 2021 | $1,122 | $19,900 | $1,100 | $18,800 |
| 2020 | $1,076 | $17,900 | $900 | $17,000 |
| 2019 | $1,076 | $17,900 | $900 | $17,000 |
| 2018 | $970 | $17,900 | $900 | $17,000 |
| 2017 | $970 | $17,900 | $900 | $17,000 |
| 2016 | $893 | $16,400 | $1,000 | $15,400 |
| 2015 | $888 | $16,400 | $1,000 | $15,400 |
| 2013 | -- | $16,100 | $1,000 | $15,100 |
Source: Public Records
Map
Nearby Homes
- 1415 Alexander Dr
- 707 Jerome Dr
- 1325 Melvin Dr
- 1321 Melvin Dr
- 1239 Hill Rd
- 1154 Daltons Way
- 0 28 72 + - Ac Horine Rd Unit MAR24072684
- 1020 Parc Central Dr
- 903 Huber St
- 1115 Huber St
- 1807 Orchard Ln
- 1808 Hawk Pointe Dr
- 661 Santschi Dr
- 907 N 6th St
- 13 Lambert Hills
- 0 Tbb Birchwood Overlook-Dogwood Unit MAR24022693
- 725 Woodrow Ave
- 1417 Westvale Dr
- 0 Tbb Birchwood Overlook Birchwo Unit MAR24022701
- 21 Flora Dr
- 1418 Horine Rd
- 1441 Alexander Dr
- 1520 Horine Rd
- 1437 Alexander Dr
- 1404 Horine Rd
- 1433 Alexander Dr
- 815 Richard Ave
- 1402 Horine Rd
- 1003 Cliff Dr
- 1601 Horine Rd
- 1429 Alexander Dr
- 811 Richard Ave
- 1336 Horine Rd
- 1009 Cliff Dr
- 1425 Alexander Dr
- 0 Alexander II @ Providence
- 0Lot 270 Providence
- 0TBB Alexander @ Savanna
- 0TBB Alexander II @ Providence
- 0TBB Alexander I @ Providence