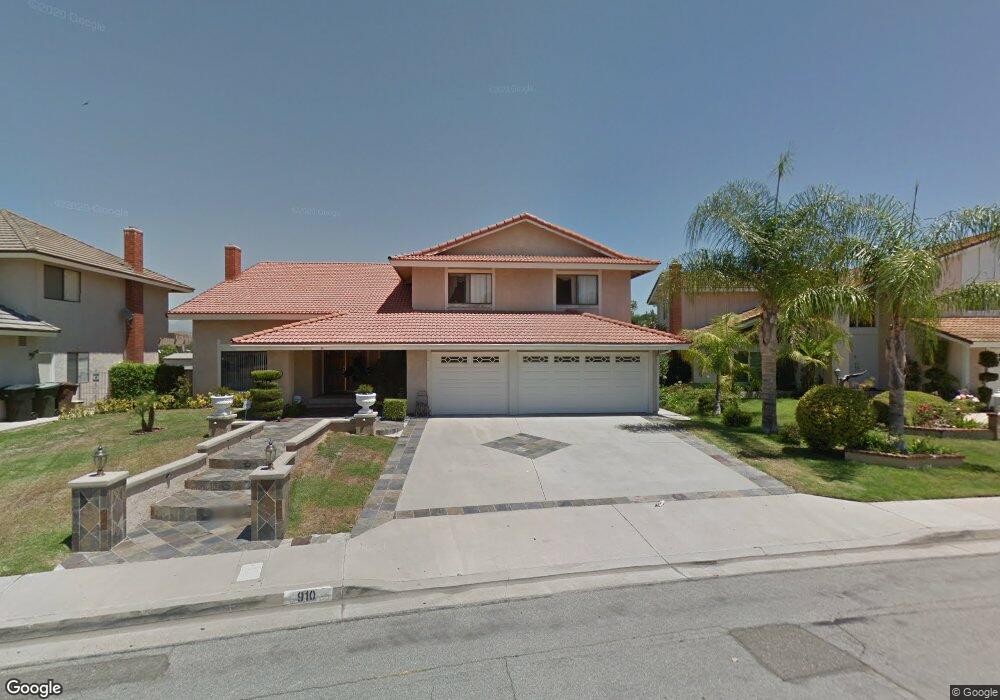
910 S Jay Cir Anaheim, CA 92808
Anaheim Hills NeighborhoodEstimated Value: $1,620,000 - $1,773,000
4
Beds
3
Baths
3,354
Sq Ft
$500/Sq Ft
Est. Value
About This Home
This home is located at 910 S Jay Cir, Anaheim, CA 92808 and is currently estimated at $1,675,421, approximately $499 per square foot. 910 S Jay Cir is a home located in Orange County with nearby schools including Canyon Rim Elementary, Canyon High School, and El Rancho Charter.
Ownership History
Date
Name
Owned For
Owner Type
Purchase Details
Closed on
Dec 5, 2019
Sold by
Shokoohi Mehdi and Shokoohi Rita Y
Bought by
Shokoohi Mehdi and Shokoohi Rita Y
Current Estimated Value
Purchase Details
Closed on
Feb 24, 2005
Sold by
Shokoohi Mehdi and Shokoohi Rita
Bought by
Shokoohi Mehdi and Shokoohi Rita Y
Purchase Details
Closed on
Oct 23, 2002
Sold by
Hertsgaard David B and Hertsgaard Rebecca S
Bought by
Shokoohi Mehdi and Shokoohi Rita
Home Financials for this Owner
Home Financials are based on the most recent Mortgage that was taken out on this home.
Original Mortgage
$436,000
Outstanding Balance
$179,178
Interest Rate
5.89%
Mortgage Type
Stand Alone First
Estimated Equity
$1,496,243
Purchase Details
Closed on
Aug 29, 1996
Sold by
Hertsgaard David B and Hertsgaard Rebecca S
Bought by
Hertsgaard David B and Hertsgaard Rebecca S
Home Financials for this Owner
Home Financials are based on the most recent Mortgage that was taken out on this home.
Original Mortgage
$389,000
Interest Rate
8.2%
Create a Home Valuation Report for This Property
The Home Valuation Report is an in-depth analysis detailing your home's value as well as a comparison with similar homes in the area
Home Values in the Area
Average Home Value in this Area
Purchase History
| Date | Buyer | Sale Price | Title Company |
|---|---|---|---|
| Shokoohi Mehdi | -- | Accommodation | |
| Shokoohi Mehdi | -- | Provident Title Company | |
| Shokoohi Mehdi | -- | -- | |
| Shokoohi Mehdi | $545,000 | First Southwestern Title Co | |
| Hertsgaard David B | -- | -- | |
| Hertsgaard David Brakke | -- | Continental Lawyers Title Co |
Source: Public Records
Mortgage History
| Date | Status | Borrower | Loan Amount |
|---|---|---|---|
| Open | Shokoohi Mehdi | $436,000 | |
| Previous Owner | Hertsgaard David Brakke | $389,000 |
Source: Public Records
Tax History
| Year | Tax Paid | Tax Assessment Tax Assessment Total Assessment is a certain percentage of the fair market value that is determined by local assessors to be the total taxable value of land and additions on the property. | Land | Improvement |
|---|---|---|---|---|
| 2025 | $8,752 | $813,743 | $460,207 | $353,536 |
| 2024 | $8,752 | $797,788 | $451,184 | $346,604 |
| 2023 | $8,559 | $782,146 | $442,338 | $339,808 |
| 2022 | $8,356 | $763,360 | $433,664 | $329,696 |
| 2021 | $7,920 | $729,226 | $425,161 | $304,065 |
| 2020 | $7,846 | $721,749 | $420,801 | $300,948 |
| 2019 | $7,745 | $707,598 | $412,550 | $295,048 |
| 2018 | $7,626 | $693,724 | $404,461 | $289,263 |
| 2017 | $7,306 | $680,122 | $396,530 | $283,592 |
| 2016 | $7,163 | $666,787 | $388,755 | $278,032 |
| 2015 | $7,069 | $656,772 | $382,916 | $273,856 |
| 2014 | $6,919 | $643,907 | $375,415 | $268,492 |
Source: Public Records
Map
Nearby Homes
- 941 S Jay Cir
- 950 S Rim Crest Dr Unit 12
- 900 S Ridgecrest Cir
- 736 S Flicker Ct
- 7912 E Monte Carlo Ave
- 1070 S Road Runner Rd
- 1098 S Sundance Dr
- 7505 E Toyon Ln
- 8027 E Naples Ln
- 7733 E Portofino Ave Unit 366
- 1099 S San Marino Way
- 8102 E Santo Ct
- 8142 E Naples Ln
- 7887 E Horizon View Dr
- 730 S Quail Cir
- 7973 E Viewrim Dr Unit 12
- 7835 E Viewrim Dr
- 7917 E Viewrim Dr
- 1065 S Hanlon Way
- 8109 E Bailey Way
- 900 S Jay Cir
- 920 S Jay Cir
- 7350 E Nightingale Cir
- 930 S Jay Cir
- 7360 E Nightingale Cir
- 911 S Jay Cir
- 921 S Jay Cir
- 940 S Jay Cir
- 7345 E Nightingale Cir
- 7355 E Nightingale Cir
- 7320 E Nightingale Cir
- 7335 E Nightingale Cir
- 7365 E Nightingale Cir
- 950 S Jay Cir
- 7380 E Nightingale Cir
- 951 S Jay Cir
- 7310 E Nightingale Cir
- 7325 E Nightingale Cir
- 960 S Jay Cir
- 7385 E Nightingale Cir
Your Personal Tour Guide
Ask me questions while you tour the home.