Estimated Value: $321,000 - $665,000
2
Beds
1
Bath
1,770
Sq Ft
$246/Sq Ft
Est. Value
About This Home
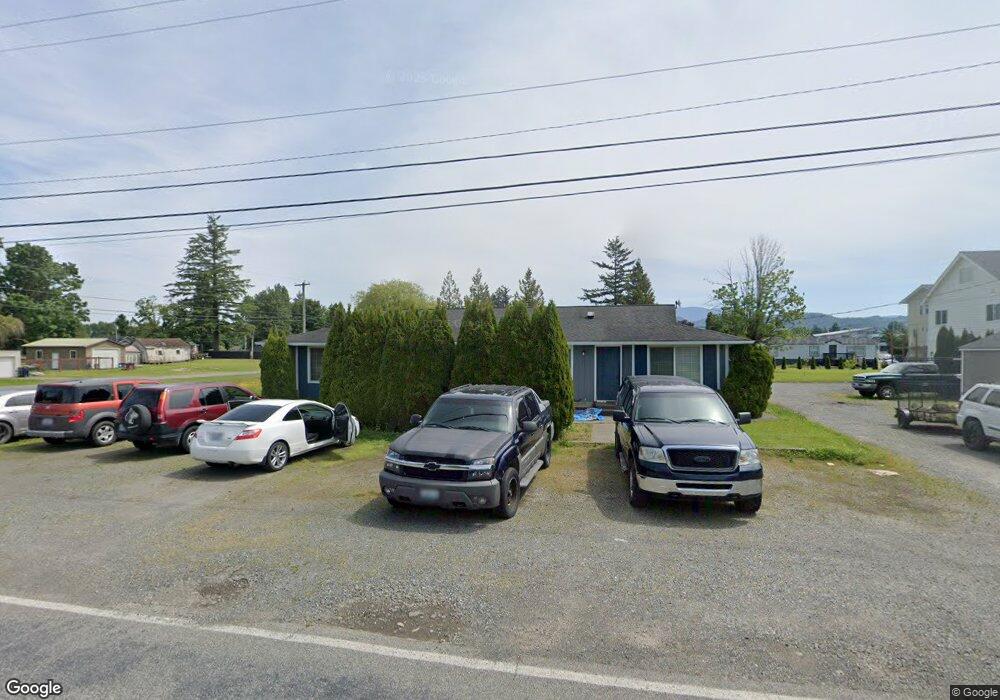
This home is located at 910 Sumas Ave, Sumas, WA 98295 and is currently estimated at $436,084, approximately $246 per square foot. 910 Sumas Ave is a home located in Whatcom County with nearby schools including Sumas Elementary School, Nooksack Elementary School, and Everson Elementary School.
Ownership History
Date
Name
Owned For
Owner Type
Purchase Details
Closed on
Nov 6, 2002
Sold by
Som Stella
Bought by
Homeland Development Llc
Current Estimated Value
Home Financials for this Owner
Home Financials are based on the most recent Mortgage that was taken out on this home.
Original Mortgage
$70,000
Outstanding Balance
$28,197
Interest Rate
5.88%
Mortgage Type
Seller Take Back
Estimated Equity
$407,887
Purchase Details
Closed on
Feb 12, 1999
Sold by
Som Stella
Bought by
Som Stella
Create a Home Valuation Report for This Property
The Home Valuation Report is an in-depth analysis detailing your home's value as well as a comparison with similar homes in the area
Purchase History
| Date | Buyer | Sale Price | Title Company |
|---|---|---|---|
| Homeland Development Llc | -- | Chicago Title Insurance | |
| Som Stella | -- | -- |
Source: Public Records
Mortgage History
| Date | Status | Borrower | Loan Amount |
|---|---|---|---|
| Open | Homeland Development Llc | $70,000 |
Source: Public Records
Tax History
| Year | Tax Paid | Tax Assessment Tax Assessment Total Assessment is a certain percentage of the fair market value that is determined by local assessors to be the total taxable value of land and additions on the property. | Land | Improvement |
|---|---|---|---|---|
| 2025 | $3,613 | $393,712 | $156,228 | $237,484 |
| 2024 | $2,929 | $381,192 | $149,500 | $231,692 |
| 2023 | $2,929 | $305,552 | $103,308 | $202,244 |
| 2022 | $2,602 | $275,278 | $93,072 | $182,206 |
| 2021 | $2,474 | $227,505 | $76,920 | $150,585 |
| 2020 | $2,372 | $184,968 | $62,538 | $122,430 |
| 2019 | $2,010 | $184,968 | $62,538 | $122,430 |
| 2018 | $2,314 | $177,461 | $60,000 | $117,461 |
| 2017 | $2,062 | $155,622 | $40,600 | $115,022 |
| 2016 | $1,944 | $143,609 | $37,450 | $106,159 |
| 2015 | $1,747 | $137,749 | $36,120 | $101,629 |
| 2014 | -- | $133,478 | $35,000 | $98,478 |
| 2013 | -- | $133,478 | $35,000 | $98,478 |
Source: Public Records
Map
Nearby Homes
- 1116 Sumas Ave Unit 1
- 1116 Sumas Ave Unit 2
- 235 Morton St
- 1305 Boon St Unit 209
- 1305 Boon St Unit 213
- 310 Second St
- 208 Harrison St
- 4135 Kamphouse Dr
- 5326 Reese Hill Rd
- 5363 Reese Hill Rd
- 5376 Reese Hill Rd
- 48 XX Reese Hill Rd
- 8388 N Pass Rd
- 5450 Reese Hill Rd
- 6801 S Pass Rd
- 5615 S Pass Rd
- 8146 Watkins Rd
- 705 E 6th St
- 303 Hayes St
- 407 E 2nd St
Your Personal Tour Guide
Ask me questions while you tour the home.