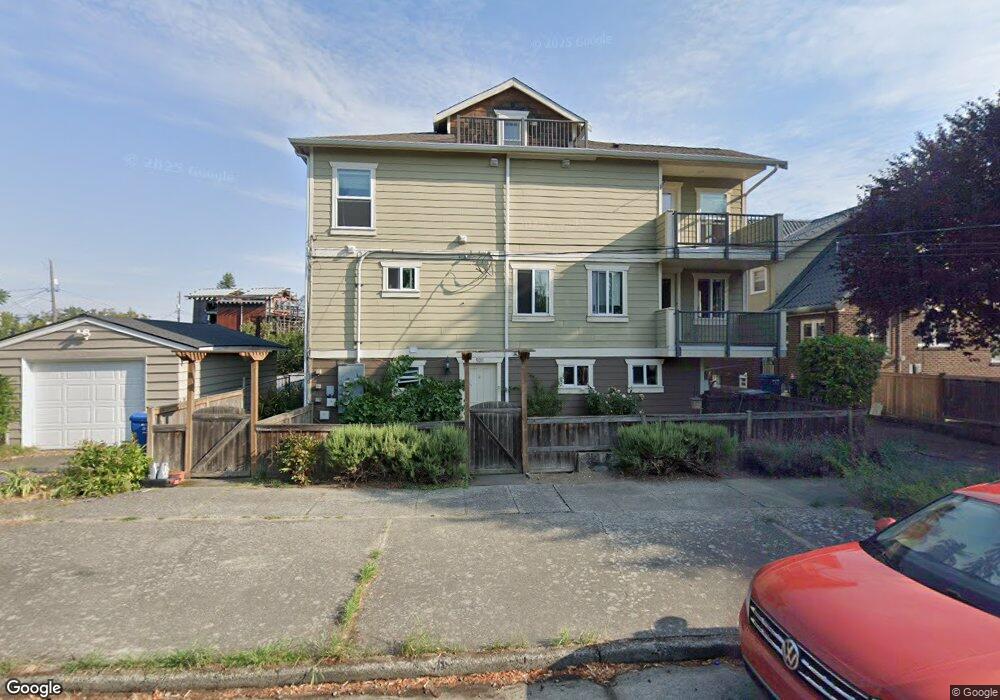
910 SW Elmgrove St Seattle, WA 98106
Highland Park NeighborhoodEstimated Value: $483,000 - $621,000
3
Beds
3
Baths
1,340
Sq Ft
$411/Sq Ft
Est. Value
About This Home
This home is located at 910 SW Elmgrove St, Seattle, WA 98106 and is currently estimated at $551,369, approximately $411 per square foot. 910 SW Elmgrove St is a home located in King County with nearby schools including Highland Park Elementary School, Denny Middle School, and Chief Sealth High School.
Ownership History
Date
Name
Owned For
Owner Type
Purchase Details
Closed on
Mar 14, 2012
Sold by
Miller James L
Bought by
Miller Linda J
Current Estimated Value
Home Financials for this Owner
Home Financials are based on the most recent Mortgage that was taken out on this home.
Original Mortgage
$116,250
Outstanding Balance
$79,741
Interest Rate
3.84%
Mortgage Type
New Conventional
Estimated Equity
$471,628
Purchase Details
Closed on
Oct 18, 2011
Sold by
Zerbato Riccardo F and Zerbato Nicole A
Bought by
Federal Home Loan Mortgage Corp
Purchase Details
Closed on
Jul 3, 2007
Sold by
Ava Douglas G and Ava Lorna L
Bought by
Zerbato Riccardo and Zerbato Nicole
Home Financials for this Owner
Home Financials are based on the most recent Mortgage that was taken out on this home.
Original Mortgage
$331,550
Interest Rate
6.36%
Create a Home Valuation Report for This Property
The Home Valuation Report is an in-depth analysis detailing your home's value as well as a comparison with similar homes in the area
Home Values in the Area
Average Home Value in this Area
Purchase History
| Date | Buyer | Sale Price | Title Company |
|---|---|---|---|
| Miller Linda J | -- | Northwest Title | |
| Pearson Michael R | -- | Northwest Title | |
| Federal Home Loan Mortgage Corp | $253,919 | None Available | |
| Zerbato Riccardo | $349,000 | Chicago Title |
Source: Public Records
Mortgage History
| Date | Status | Borrower | Loan Amount |
|---|---|---|---|
| Open | Pearson Michael R | $116,250 | |
| Previous Owner | Zerbato Riccardo | $331,550 |
Source: Public Records
Tax History Compared to Growth
Tax History
| Year | Tax Paid | Tax Assessment Tax Assessment Total Assessment is a certain percentage of the fair market value that is determined by local assessors to be the total taxable value of land and additions on the property. | Land | Improvement |
|---|---|---|---|---|
| 2024 | $5,100 | $527,000 | $273,000 | $254,000 |
| 2023 | $4,457 | $483,000 | $250,000 | $233,000 |
| 2022 | $4,248 | $520,000 | $212,000 | $308,000 |
| 2021 | $4,086 | $456,000 | $142,000 | $314,000 |
| 2020 | $4,068 | $416,000 | $131,000 | $285,000 |
| 2018 | $3,509 | $431,000 | $133,000 | $298,000 |
| 2017 | $2,937 | $349,000 | $109,000 | $240,000 |
| 2016 | $2,593 | $301,000 | $95,000 | $206,000 |
| 2015 | $2,493 | $259,000 | $71,000 | $188,000 |
| 2014 | -- | $246,000 | $66,000 | $180,000 |
| 2013 | -- | $207,000 | $57,000 | $150,000 |
Source: Public Records
Map
Nearby Homes
- 8100 8th Ave SW
- 7610 8th Ave SW
- 7600 Highland Park Way SW
- 7748 14th Ave SW
- 8139 14th Ave SW
- 1400 SW Thistle St
- 600 SW Cloverdale St
- 1603 SW Kenyon St
- 1605 SW Kenyon St
- 8117 16th Ave SW
- 7901 16th Ave SW
- 7502 14th Ave SW
- 8826 10th Ave SW
- 7749 17th Ave SW
- 1807 SW Elmgrove St
- 8105 18th Ave SW
- 8822 9th Ave SW
- 7341 16th Ave SW
- 1111 SW Henderson St
- 7932 Delridge Way SW
- 912 SW Elmgrove St
- 900 SW Elmgrove St
- 7953 9th Ave SW Unit B
- 7953 9th Ave SW
- 7953 9th Ave SW Unit A
- 7957 9th Ave SW
- 7952 10th Ave SW
- 7956 10th Ave SW
- 7951 9th Ave SW
- 7948 10th Ave SW
- 7943 9th Ave SW Unit C
- 7943 9th Ave SW Unit B
- 7943 9th Ave SW Unit A
- 7943 9th Ave SW
- 7945 9th Ave SW
- 7944 10th Ave SW
- 8103 9th Ave SW
- 7940 10th Ave SW
- 8102 10th Ave SW
- 7937 9th Ave SW