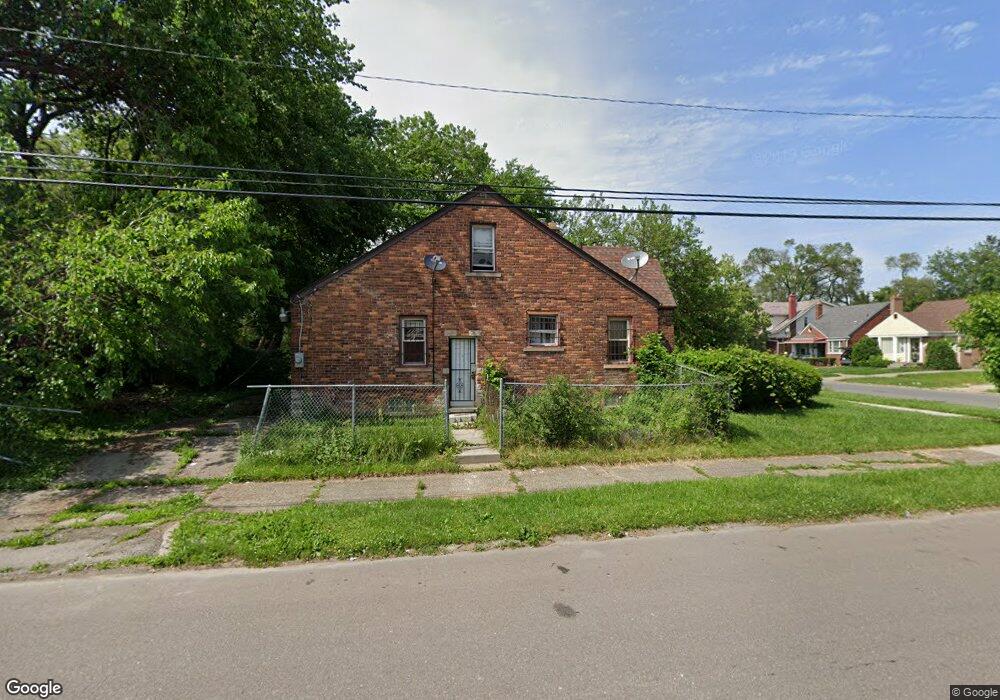
9101 Cheyenne St Detroit, MI 48228
Barton-McFarland NeighborhoodEstimated Value: $81,000 - $99,000
--
Bed
2
Baths
941
Sq Ft
$97/Sq Ft
Est. Value
About This Home
This home is located at 9101 Cheyenne St, Detroit, MI 48228 and is currently estimated at $91,333, approximately $97 per square foot. 9101 Cheyenne St is a home located in Wayne County with nearby schools including Bates Academy, Charles L. Spain Elementary-Middle School, and Edward 'Duke' Ellington Conservatory of Music and Art.
Ownership History
Date
Name
Owned For
Owner Type
Purchase Details
Closed on
Jun 1, 2023
Sold by
Detroit Rental Fund 4 Llc
Bought by
Dru Realty Investments Llc
Current Estimated Value
Purchase Details
Closed on
Oct 6, 2022
Sold by
Wayne County Treasurer
Bought by
Detroit Rental Fund 4 Llc
Purchase Details
Closed on
Feb 14, 2014
Sold by
Suburban Renaissance Vii Llc
Bought by
Sherrors Charles Dewon and Sherrors Jean Nicole
Purchase Details
Closed on
Nov 16, 2012
Sold by
Wayne County Treasurer
Bought by
Suburban Renaissance Vii Llc
Purchase Details
Closed on
Mar 12, 2008
Sold by
Harper James and Harper Kelli G
Bought by
Figgins Marvin
Purchase Details
Closed on
Jul 2, 2007
Sold by
Wells Fargo Bank Na
Bought by
Harper James
Purchase Details
Closed on
Mar 29, 2006
Sold by
Mcgee Sadie
Bought by
Option One Mortgage Corp
Create a Home Valuation Report for This Property
The Home Valuation Report is an in-depth analysis detailing your home's value as well as a comparison with similar homes in the area
Home Values in the Area
Average Home Value in this Area
Purchase History
| Date | Buyer | Sale Price | Title Company |
|---|---|---|---|
| Dru Realty Investments Llc | -- | None Listed On Document | |
| Dru Realty Investments Llc | -- | None Listed On Document | |
| Detroit Rental Fund 4 Llc | $25,234 | -- | |
| Sherrors Charles Dewon | $1,900 | None Available | |
| Suburban Renaissance Vii Llc | $5,200 | None Available | |
| Figgins Marvin | $100,000 | None Available | |
| Harper James | $18,000 | Attorneys Title Agency Inc | |
| Wells Fargo Bank Na | -- | Attorneys Title | |
| Option One Mortgage Corp | $72,670 | None Available |
Source: Public Records
Tax History Compared to Growth
Tax History
| Year | Tax Paid | Tax Assessment Tax Assessment Total Assessment is a certain percentage of the fair market value that is determined by local assessors to be the total taxable value of land and additions on the property. | Land | Improvement |
|---|---|---|---|---|
| 2025 | $2,496 | $43,300 | $0 | $0 |
| 2024 | $2,496 | $36,200 | $0 | $0 |
| 2023 | $2,426 | $28,400 | $0 | $0 |
| 2022 | $1,358 | $23,300 | $0 | $0 |
| 2021 | $1,321 | $17,500 | $0 | $0 |
| 2020 | $1,320 | $16,400 | $0 | $0 |
| 2019 | $1,300 | $12,600 | $0 | $0 |
| 2018 | $928 | $11,700 | $0 | $0 |
| 2017 | $243 | $12,800 | $0 | $0 |
| 2016 | $1,142 | $17,300 | $0 | $0 |
| 2015 | $1,271 | $17,300 | $0 | $0 |
| 2013 | $2,423 | $24,227 | $0 | $0 |
| 2010 | -- | $34,713 | $915 | $33,798 |
Source: Public Records
Map
Nearby Homes
- 9244 Littlefield St
- 9251 Cheyenne St
- 9141 Hartwell St
- 9150 Schaefer Hwy
- 9231 Sorrento St
- 9300 Cheyenne St
- 8919 Steel St
- 9317 Ward St
- 9241 Steel St
- 9297 Hartwell St
- 9352 Hartwell St
- 9371 Hartwell St
- 9327 Schaefer Hwy
- 9385 Hartwell St
- 9185 Meyers Rd
- 8537 Cheyenne St
- 9242 Appoline St
- 9394 Sorrento St
- 9145 Decatur St
- 9137 Meyers Rd
- 9111 Cheyenne St
- 9117 Cheyenne St
- 9125 Cheyenne St
- 8943 Cheyenne St
- 9100 Littlefield St
- 9110 Littlefield St
- 8935 Cheyenne St
- 9118 Littlefield St
- 9133 Cheyenne St
- 8942 Littlefield St
- 9126 Littlefield St
- 9141 Cheyenne St
- 8929 Cheyenne St
- 9102 Cheyenne St
- 9112 Cheyenne St
- 9132 Littlefield St
- 8934 Littlefield St
- 9118 Cheyenne St
- 8921 Cheyenne St
- 9124 Cheyenne St