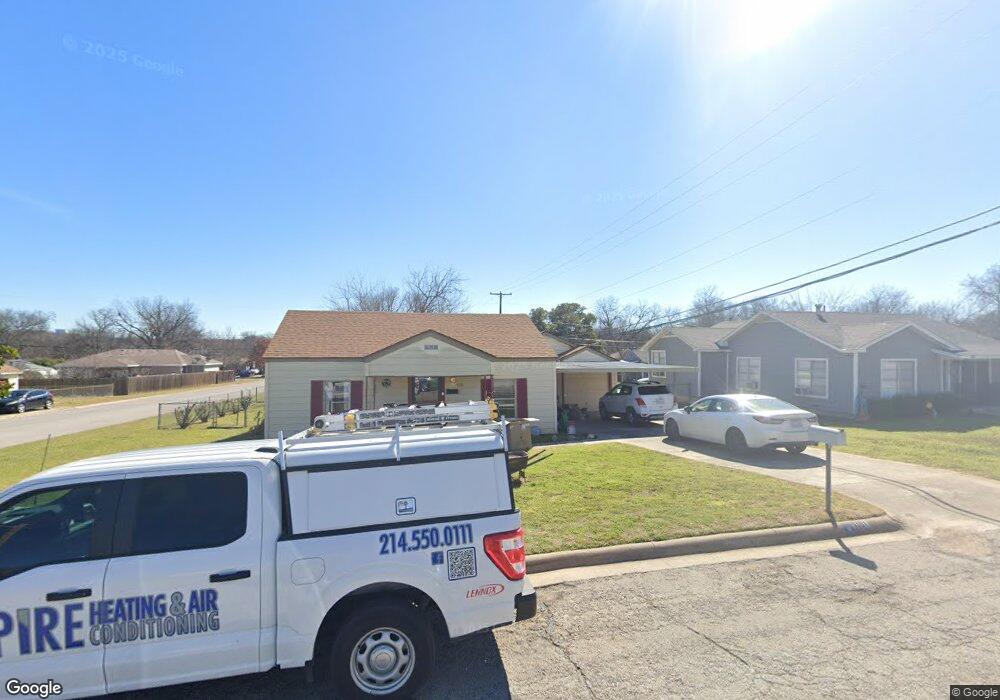
9101 Farmers Rd Fort Worth, TX 76108
Estimated Value: $220,000 - $251,000
3
Beds
2
Baths
1,474
Sq Ft
$159/Sq Ft
Est. Value
About This Home
This home is located at 9101 Farmers Rd, Fort Worth, TX 76108 and is currently estimated at $234,132, approximately $158 per square foot. 9101 Farmers Rd is a home located in Tarrant County with nearby schools including West Elementary School, Brewer Middle School, and Tannahill Intermediate School.
Ownership History
Date
Name
Owned For
Owner Type
Purchase Details
Closed on
Aug 26, 2005
Sold by
Hall Vicki
Bought by
Landers Kelly A
Current Estimated Value
Home Financials for this Owner
Home Financials are based on the most recent Mortgage that was taken out on this home.
Original Mortgage
$82,845
Outstanding Balance
$44,211
Interest Rate
5.81%
Mortgage Type
FHA
Estimated Equity
$189,921
Purchase Details
Closed on
May 20, 2005
Sold by
Hud
Bought by
Hall Vicki
Purchase Details
Closed on
Feb 1, 2005
Sold by
Mortgage Electronic Registration Systems
Bought by
Hud
Purchase Details
Closed on
Dec 21, 1998
Sold by
Rose Mary Lou Singleton
Bought by
Massey Synthia Leigh and Mooney Dolores J
Home Financials for this Owner
Home Financials are based on the most recent Mortgage that was taken out on this home.
Original Mortgage
$45,177
Interest Rate
6.92%
Mortgage Type
FHA
Create a Home Valuation Report for This Property
The Home Valuation Report is an in-depth analysis detailing your home's value as well as a comparison with similar homes in the area
Home Values in the Area
Average Home Value in this Area
Purchase History
| Date | Buyer | Sale Price | Title Company |
|---|---|---|---|
| Landers Kelly A | -- | Reunion Title | |
| Hall Vicki | -- | First American Title | |
| Hud | -- | -- | |
| Mortgage Electronic Registration Systems | $45,936 | -- | |
| Massey Synthia Leigh | -- | Fidelity National Title |
Source: Public Records
Mortgage History
| Date | Status | Borrower | Loan Amount |
|---|---|---|---|
| Open | Landers Kelly A | $82,845 | |
| Previous Owner | Massey Synthia Leigh | $45,177 | |
| Closed | Massey Synthia Leigh | $2,655 |
Source: Public Records
Tax History Compared to Growth
Tax History
| Year | Tax Paid | Tax Assessment Tax Assessment Total Assessment is a certain percentage of the fair market value that is determined by local assessors to be the total taxable value of land and additions on the property. | Land | Improvement |
|---|---|---|---|---|
| 2025 | $1,033 | $220,813 | $50,712 | $170,101 |
| 2024 | $1,033 | $220,813 | $50,712 | $170,101 |
| 2023 | $2,248 | $228,379 | $50,712 | $177,667 |
| 2022 | $2,327 | $176,782 | $25,000 | $151,782 |
| 2021 | $2,149 | $132,565 | $25,000 | $107,565 |
| 2020 | $1,968 | $110,530 | $25,000 | $85,530 |
| 2019 | $1,857 | $121,646 | $25,000 | $96,646 |
| 2018 | $1,219 | $58,697 | $12,000 | $46,697 |
| 2017 | $1,559 | $85,342 | $12,000 | $73,342 |
| 2016 | $1,418 | $93,203 | $12,000 | $81,203 |
| 2015 | $975 | $44,100 | $12,400 | $31,700 |
| 2014 | $975 | $44,100 | $12,400 | $31,700 |
Source: Public Records
Map
Nearby Homes
- 9200 Farmers Rd
- 9100 Rowland Dr
- 9104 White Settlement Rd
- 9221 White Settlement Rd
- 2860 Fox Trail Ln
- 10937 Elata Dr
- 204 Lanham Ct
- 201 N Normandale St
- 405 S Las Vegas Trail
- 407 S Las Vegas Trail
- 409 S Las Vegas Trail
- 428 S Las Vegas Trail
- 411 S Las Vegas Trail
- 508 Grant Cir
- 105 Lockwood St
- 641 S Redford Ln
- 501 Allencrest Dr
- 8528 Pemberton Ct
- 308 Hallvale Dr
- 800 Pemberton St
- 9105 Farmers Rd
- 9025 Farmers Rd
- 9109 Farmers Rd
- 9104 Oels St
- 9021 Farmers Rd
- 9100 Farmers Rd
- 9024 Oels St
- 9104 Farmers Rd
- 9108 Oels St
- 9113 Farmers Rd
- 9108 Farmers Rd
- 9024 Farmers Rd
- 9112 Farmers Rd
- 9020 Oels St
- 9112 Oels St
- 9017 Farmers Rd
- 9020 Farmers Rd
- 9117 Farmers Rd
- 9116 Farmers Rd
- 9016 Oels St