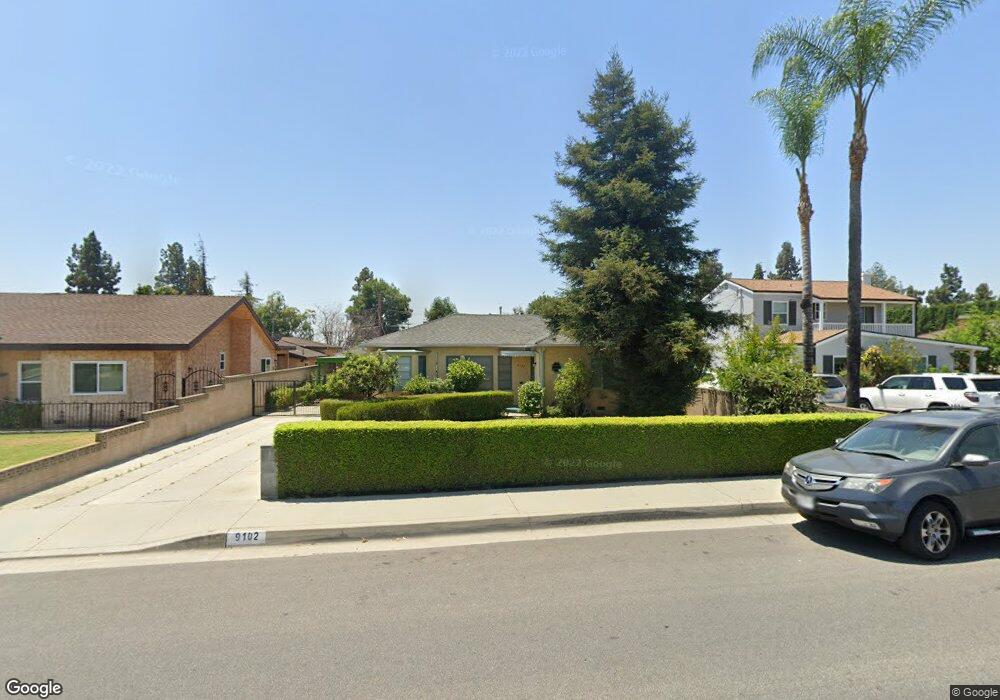
9102 Broadway Temple City, CA 91780
Estimated Value: $1,152,927 - $1,389,000
3
Beds
2
Baths
1,732
Sq Ft
$716/Sq Ft
Est. Value
About This Home
This home is located at 9102 Broadway, Temple City, CA 91780 and is currently estimated at $1,239,732, approximately $715 per square foot. 9102 Broadway is a home located in Los Angeles County with nearby schools including La Rosa Elementary, Oak Avenue Intermediate School, and Temple City High School.
Ownership History
Date
Name
Owned For
Owner Type
Purchase Details
Closed on
Aug 22, 2008
Sold by
Lau Kamwing and Laung Laiching
Bought by
Lau Kamwing and Laung Laiching
Current Estimated Value
Purchase Details
Closed on
Mar 19, 1997
Sold by
Huang Yueh I
Bought by
Lau Kamwing and Laung Laiching
Home Financials for this Owner
Home Financials are based on the most recent Mortgage that was taken out on this home.
Original Mortgage
$150,000
Outstanding Balance
$18,012
Interest Rate
7.63%
Estimated Equity
$1,221,720
Purchase Details
Closed on
Aug 4, 1995
Sold by
Andreu Rose Mary and Andreu Henry A
Bought by
Huang Yueh I
Home Financials for this Owner
Home Financials are based on the most recent Mortgage that was taken out on this home.
Original Mortgage
$160,000
Interest Rate
7.88%
Purchase Details
Closed on
Jul 7, 1994
Sold by
Frilot Lucille and Frilot Henry A
Bought by
Andreu Rosemary
Create a Home Valuation Report for This Property
The Home Valuation Report is an in-depth analysis detailing your home's value as well as a comparison with similar homes in the area
Home Values in the Area
Average Home Value in this Area
Purchase History
| Date | Buyer | Sale Price | Title Company |
|---|---|---|---|
| Lau Kamwing | -- | None Available | |
| Lau Kamwing | $200,000 | California Counties Title Co | |
| Huang Yueh I | $220,000 | Title Land Company | |
| Andreu Rosemary | -- | -- |
Source: Public Records
Mortgage History
| Date | Status | Borrower | Loan Amount |
|---|---|---|---|
| Open | Lau Kamwing | $150,000 | |
| Previous Owner | Huang Yueh I | $160,000 |
Source: Public Records
Tax History Compared to Growth
Tax History
| Year | Tax Paid | Tax Assessment Tax Assessment Total Assessment is a certain percentage of the fair market value that is determined by local assessors to be the total taxable value of land and additions on the property. | Land | Improvement |
|---|---|---|---|---|
| 2025 | $4,176 | $325,713 | $197,874 | $127,839 |
| 2024 | $4,176 | $319,328 | $193,995 | $125,333 |
| 2023 | $4,084 | $313,068 | $190,192 | $122,876 |
| 2022 | $3,839 | $306,930 | $186,463 | $120,467 |
| 2021 | $3,890 | $300,912 | $182,807 | $118,105 |
| 2019 | $3,758 | $291,988 | $177,386 | $114,602 |
| 2018 | $3,589 | $286,263 | $173,908 | $112,355 |
| 2016 | $3,428 | $275,149 | $167,156 | $107,993 |
| 2015 | $3,370 | $271,017 | $164,646 | $106,371 |
| 2014 | $3,328 | $265,709 | $161,421 | $104,288 |
Source: Public Records
Map
Nearby Homes
- 5463 Sultana Ave
- 5619 Sultana Ave Unit A
- 5241 Rosemead Blvd Unit B
- 5530 Alessandro Ave
- 9409 Olive St
- 9224 Pentland St
- 0 Sultana Ave
- 9459 Workman Ave
- 9406 La Rosa Dr
- 4909 Acacia St
- 5929 Oak Ave
- 8739 E Sienna Ln
- 9063 Evansport Dr
- 9538 Pentland St
- 1349 Elm Ave
- 1230 Elm Ave Unit G
- 5032 Fiesta Ave
- 9109 Lower Azusa Rd
- 4850 Heleo Ave
- 1120 E Las Tunas Dr Unit 2
- 9108 Broadway
- 9082 Broadway
- 9114 Broadway
- 9076 Broadway
- 9120 Broadway
- 9070 Broadway
- 5504 Harker Ave
- 9109 Rancho Real Rd
- 9105 Broadway
- 9083 Rancho Real Rd
- 9111 Broadway
- 9115 Rancho Real Rd
- 9077 Rancho Real Rd
- 9126 Broadway
- 9064 Broadway
- 5505 Harker Ave
- 9121 Rancho Real Rd
- 5508 Harker Ave
- 9069 Rancho Real Rd
- 9063 Rancho Real Rd