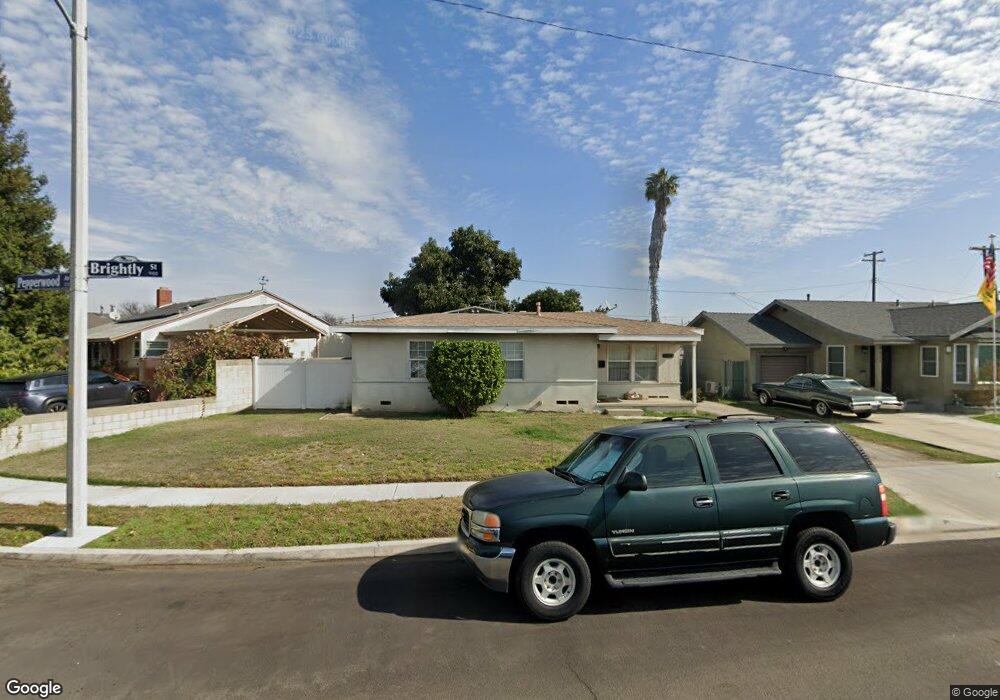
9105 Brightly St Bellflower, CA 90706
Estimated Value: $685,000 - $800,000
3
Beds
1
Bath
1,009
Sq Ft
$732/Sq Ft
Est. Value
About This Home
This home is located at 9105 Brightly St, Bellflower, CA 90706 and is currently estimated at $738,831, approximately $732 per square foot. 9105 Brightly St is a home located in Los Angeles County with nearby schools including Lewis Elementary School, Sussman Middle School, and Downey High School.
Ownership History
Date
Name
Owned For
Owner Type
Purchase Details
Closed on
Sep 14, 2009
Sold by
Simmons Edwin W
Bought by
Simmons Edwin W and Simmons Julie A
Current Estimated Value
Home Financials for this Owner
Home Financials are based on the most recent Mortgage that was taken out on this home.
Original Mortgage
$234,400
Outstanding Balance
$153,763
Interest Rate
5.25%
Mortgage Type
New Conventional
Estimated Equity
$585,068
Purchase Details
Closed on
Sep 11, 2009
Sold by
Simmons Edwin W and Simmons Julie A
Bought by
Simmons Edwin W
Home Financials for this Owner
Home Financials are based on the most recent Mortgage that was taken out on this home.
Original Mortgage
$234,400
Outstanding Balance
$153,763
Interest Rate
5.25%
Mortgage Type
New Conventional
Estimated Equity
$585,068
Purchase Details
Closed on
Mar 12, 2003
Sold by
Simmons Julie A and Powell Family Trust
Bought by
Simmons Edwin W and Simmons Julie A
Create a Home Valuation Report for This Property
The Home Valuation Report is an in-depth analysis detailing your home's value as well as a comparison with similar homes in the area
Home Values in the Area
Average Home Value in this Area
Purchase History
| Date | Buyer | Sale Price | Title Company |
|---|---|---|---|
| Simmons Edwin W | -- | Accommodation | |
| Simmons Edwin W | -- | Lsi Local Solutions | |
| Simmons Edwin W | -- | -- |
Source: Public Records
Mortgage History
| Date | Status | Borrower | Loan Amount |
|---|---|---|---|
| Open | Simmons Edwin W | $234,400 | |
| Closed | Simmons Edwin W | $234,400 |
Source: Public Records
Tax History
| Year | Tax Paid | Tax Assessment Tax Assessment Total Assessment is a certain percentage of the fair market value that is determined by local assessors to be the total taxable value of land and additions on the property. | Land | Improvement |
|---|---|---|---|---|
| 2025 | $1,276 | $60,736 | $26,687 | $34,049 |
| 2024 | $1,276 | $59,546 | $26,164 | $33,382 |
| 2023 | $1,245 | $58,379 | $25,651 | $32,728 |
| 2022 | $1,198 | $57,236 | $25,149 | $32,087 |
| 2021 | $1,173 | $56,114 | $24,656 | $31,458 |
| 2019 | $1,148 | $54,452 | $23,926 | $30,526 |
| 2018 | $1,028 | $53,385 | $23,457 | $29,928 |
| 2016 | $982 | $51,315 | $22,548 | $28,767 |
| 2015 | $1,083 | $50,545 | $22,210 | $28,335 |
| 2014 | $938 | $49,555 | $21,775 | $27,780 |
Source: Public Records
Map
Nearby Homes
- 13440 Lakewood Blvd Unit 97
- 13440 Lakewood Blvd Unit 96
- 13440 Lakewood Blvd Unit 95
- 13247 Deming Ave
- 9220 Birdvale Dr
- 9161 Priscilla St
- 9420 Hoback St
- 13317 Bixler Ave
- 13947 Downey Ave
- 8600 Contreras St Unit 35
- 9324 Mandale St
- 13623 Fanshaw Ave
- 9327 Faywood St
- 8330 Elburg St
- 9020 Somerset Blvd Unit 19
- 8502 Borson St
- 8333 Puritan St
- 8217 Howe St
- 12532 Lakewood Blvd Unit 12
- 13438 Obispo Ave
- 13352 Pepperwood Ave
- 9111 Brightly St
- 9115 Brightly St
- 9104 Hargill St
- 9124 Hargill St
- 9118 Hargill St
- 9121 Brightly St
- 13355 Pepperwood Ave
- 9110 Brightly St
- 9134 Hargill St
- 13361 Pepperwood Ave
- 13351 Pepperwood Ave
- 13365 Pepperwood Ave
- 13345 Pepperwood Ave
- 9125 Brightly St
- 9140 Hargill St
- 13403 Pepperwood Ave
- 9120 Brightly St
- 13337 Pepperwood Ave
- 13334 Pepperwood Ave
Your Personal Tour Guide
Ask me questions while you tour the home.