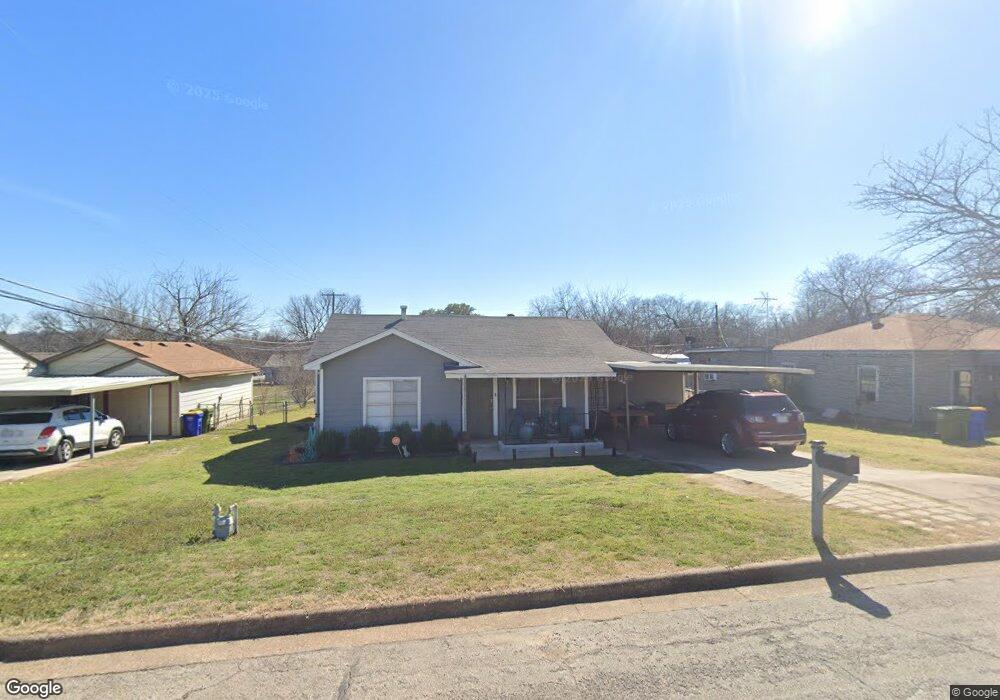
9105 Farmers Rd Fort Worth, TX 76108
Estimated Value: $207,000 - $245,000
3
Beds
2
Baths
1,432
Sq Ft
$160/Sq Ft
Est. Value
About This Home
This home is located at 9105 Farmers Rd, Fort Worth, TX 76108 and is currently estimated at $229,813, approximately $160 per square foot. 9105 Farmers Rd is a home located in Tarrant County with nearby schools including West Elementary School, Brewer Middle School, and Tannahill Intermediate School.
Ownership History
Date
Name
Owned For
Owner Type
Purchase Details
Closed on
Aug 15, 2011
Sold by
Garcia Jerry
Bought by
Smith Vivian
Current Estimated Value
Purchase Details
Closed on
Sep 23, 2010
Sold by
Fannie Mae
Bought by
Garcia Jerry
Purchase Details
Closed on
Jun 9, 2010
Sold by
Colonial Savings Fa
Bought by
Federal National Mortgage Association
Purchase Details
Closed on
Jun 3, 2010
Sold by
Anderson Beth Ann and Anderson James L
Bought by
Colonial Savings Fa
Purchase Details
Closed on
Jul 16, 1998
Sold by
Stephenson Warren I and Stephenson Edith L
Bought by
Anderson James L and Anderson Beth Ann
Home Financials for this Owner
Home Financials are based on the most recent Mortgage that was taken out on this home.
Original Mortgage
$38,800
Interest Rate
7.09%
Create a Home Valuation Report for This Property
The Home Valuation Report is an in-depth analysis detailing your home's value as well as a comparison with similar homes in the area
Home Values in the Area
Average Home Value in this Area
Purchase History
| Date | Buyer | Sale Price | Title Company |
|---|---|---|---|
| Smith Vivian | -- | None Available | |
| Garcia Jerry | -- | Stnt | |
| Federal National Mortgage Association | -- | None Available | |
| Colonial Savings Fa | $27,977 | None Available | |
| Anderson James L | -- | Safeco Land Title |
Source: Public Records
Mortgage History
| Date | Status | Borrower | Loan Amount |
|---|---|---|---|
| Previous Owner | Anderson James L | $38,800 |
Source: Public Records
Tax History Compared to Growth
Tax History
| Year | Tax Paid | Tax Assessment Tax Assessment Total Assessment is a certain percentage of the fair market value that is determined by local assessors to be the total taxable value of land and additions on the property. | Land | Improvement |
|---|---|---|---|---|
| 2025 | $1,099 | $217,108 | $47,575 | $169,533 |
| 2024 | $1,099 | $217,108 | $47,575 | $169,533 |
| 2023 | $2,314 | $224,565 | $47,575 | $176,990 |
| 2022 | $2,396 | $176,574 | $25,000 | $151,574 |
| 2021 | $2,212 | $133,143 | $25,000 | $108,143 |
| 2020 | $2,026 | $111,298 | $25,000 | $86,298 |
| 2019 | $1,912 | $122,243 | $25,000 | $97,243 |
| 2018 | $1,266 | $60,427 | $12,000 | $48,427 |
| 2017 | $1,605 | $86,744 | $12,000 | $74,744 |
| 2016 | $1,459 | $93,386 | $12,000 | $81,386 |
| 2015 | $1,304 | $45,400 | $12,400 | $33,000 |
| 2014 | $1,304 | $45,400 | $12,400 | $33,000 |
Source: Public Records
Map
Nearby Homes
- 9200 Farmers Rd
- 9100 Rowland Dr
- 9104 White Settlement Rd
- 9221 White Settlement Rd
- 2860 Fox Trail Ln
- 10937 Elata Dr
- 204 Lanham Ct
- 201 N Normandale St
- 405 S Las Vegas Trail
- 407 S Las Vegas Trail
- 409 S Las Vegas Trail
- 428 S Las Vegas Trail
- 411 S Las Vegas Trail
- 508 Grant Cir
- 105 Lockwood St
- 641 S Redford Ln
- 501 Allencrest Dr
- 8528 Pemberton Ct
- 308 Hallvale Dr
- 800 Pemberton St
- 9101 Farmers Rd
- 9109 Farmers Rd
- 9113 Farmers Rd
- 9104 Oels St
- 9108 Oels St
- 9025 Farmers Rd
- 9104 Farmers Rd
- 9108 Farmers Rd
- 9117 Farmers Rd
- 9112 Oels St
- 9100 Farmers Rd
- 9112 Farmers Rd
- 9116 Farmers Rd
- 9024 Oels St
- 9116 Oels St
- 9021 Farmers Rd
- 9120 Farmers Rd
- 9024 Farmers Rd
- 9121 Farmers Rd
- 9020 Oels St