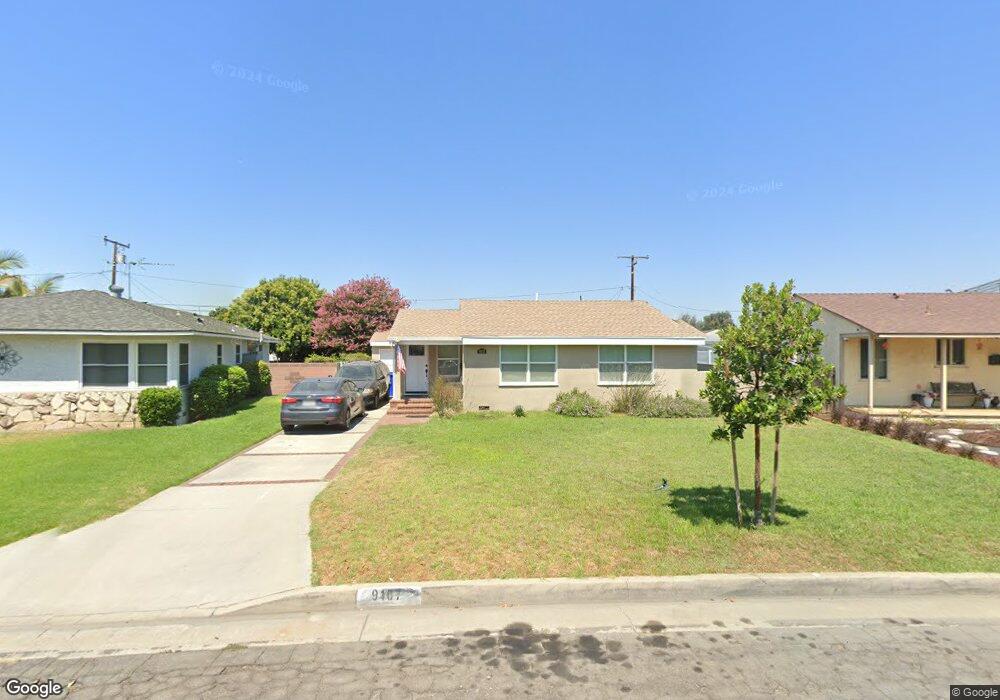
9107 Garnish Dr Downey, CA 90240
Estimated Value: $888,000 - $1,000,000
2
Beds
2
Baths
1,418
Sq Ft
$659/Sq Ft
Est. Value
About This Home
This home is located at 9107 Garnish Dr, Downey, CA 90240 and is currently estimated at $934,316, approximately $658 per square foot. 9107 Garnish Dr is a home located in Los Angeles County with nearby schools including Rio San Gabriel Elementary School, Doty Middle School, and Downey High School.
Ownership History
Date
Name
Owned For
Owner Type
Purchase Details
Closed on
Sep 29, 2011
Sold by
Michinard Marie Sa and Sa Valdez Marie L
Bought by
Michinard 3Rd George S and Michinard Marie Sa
Current Estimated Value
Purchase Details
Closed on
Dec 22, 2006
Sold by
Valdez Daniel
Bought by
Sa Valdez Marie L
Home Financials for this Owner
Home Financials are based on the most recent Mortgage that was taken out on this home.
Original Mortgage
$435,200
Outstanding Balance
$257,567
Interest Rate
6.22%
Mortgage Type
New Conventional
Estimated Equity
$676,749
Purchase Details
Closed on
Apr 25, 2002
Sold by
Sa Rod and Sa Ruby
Bought by
Valdez Daniel and Sa Valdez Marie L
Purchase Details
Closed on
Apr 20, 2001
Sold by
Pak Chong Sun
Bought by
Sa Rod and Sa Ruby
Home Financials for this Owner
Home Financials are based on the most recent Mortgage that was taken out on this home.
Original Mortgage
$231,300
Interest Rate
7.15%
Create a Home Valuation Report for This Property
The Home Valuation Report is an in-depth analysis detailing your home's value as well as a comparison with similar homes in the area
Purchase History
| Date | Buyer | Sale Price | Title Company |
|---|---|---|---|
| Michinard 3Rd George S | -- | None Available | |
| Sa Valdez Marie L | -- | Fidelity National Title Co | |
| Valdez Daniel | -- | -- | |
| Sa Rod | $257,000 | Fidelity Title |
Source: Public Records
Mortgage History
| Date | Status | Borrower | Loan Amount |
|---|---|---|---|
| Open | Sa Valdez Marie L | $435,200 | |
| Previous Owner | Sa Rod | $231,300 |
Source: Public Records
Tax History
| Year | Tax Paid | Tax Assessment Tax Assessment Total Assessment is a certain percentage of the fair market value that is determined by local assessors to be the total taxable value of land and additions on the property. | Land | Improvement |
|---|---|---|---|---|
| 2025 | $6,391 | $499,413 | $307,267 | $192,146 |
| 2024 | $6,391 | $489,622 | $301,243 | $188,379 |
| 2023 | $6,177 | $480,023 | $295,337 | $184,686 |
| 2022 | $5,870 | $470,612 | $289,547 | $181,065 |
| 2021 | $5,742 | $461,385 | $283,870 | $177,515 |
| 2020 | $5,656 | $456,655 | $280,960 | $175,695 |
| 2019 | $426 | $354,901 | $275,451 | $79,450 |
| 2018 | $4,332 | $347,943 | $270,050 | $77,893 |
| 2016 | $4,204 | $334,433 | $259,564 | $74,869 |
| 2015 | $4,145 | $329,411 | $255,666 | $73,745 |
| 2014 | $3,918 | $322,959 | $250,658 | $72,301 |
Source: Public Records
Map
Nearby Homes
- 9145 Raviller Dr
- 9225 Sideview Dr
- 9069 Gallatin Rd
- 9440 Gallatin Rd
- 8901 Serapis Ave Unit 25
- 9378 Suva St
- 9017 Arrington Ave
- 8611 Eglise Ave
- 9125 Gainford St
- 8604 Whittle Ct
- 9434 Pico Vista Rd
- 9905 Pangborn Ave
- 9363 Dinsdale St
- 8414 Cravell Ave
- 9246 Manzanar Ave
- 9355 Florence Ave
- 8328 Buhman Ave
- 10214 Woodruff Ave
- 9734 Terradell St
- 10005 Birchdale Ave
- 9103 Garnish Dr
- 9113 Garnish Dr
- 9119 Garnish Dr
- 9116 Lemoran Ave
- 9108 Lemoran Ave
- 9122 Lemoran Ave
- 9102 Lemoran Ave
- 9128 Lemoran Ave
- 9125 Garnish Dr
- 9110 Garnish Dr
- 9102 Garnish Dr
- 9118 Garnish Dr
- 9134 Lemoran Ave
- 9131 Garnish Dr
- 9124 Garnish Dr
- 9202 Lemoran Ave
- 9130 Garnish Dr
- 9117 Lemoran Ave
- 9137 Garnish Dr
- 9113 Lemoran Ave
Your Personal Tour Guide
Ask me questions while you tour the home.