Estimated Value: $235,000 - $327,000
4
Beds
2
Baths
1,462
Sq Ft
$205/Sq Ft
Est. Value
About This Home
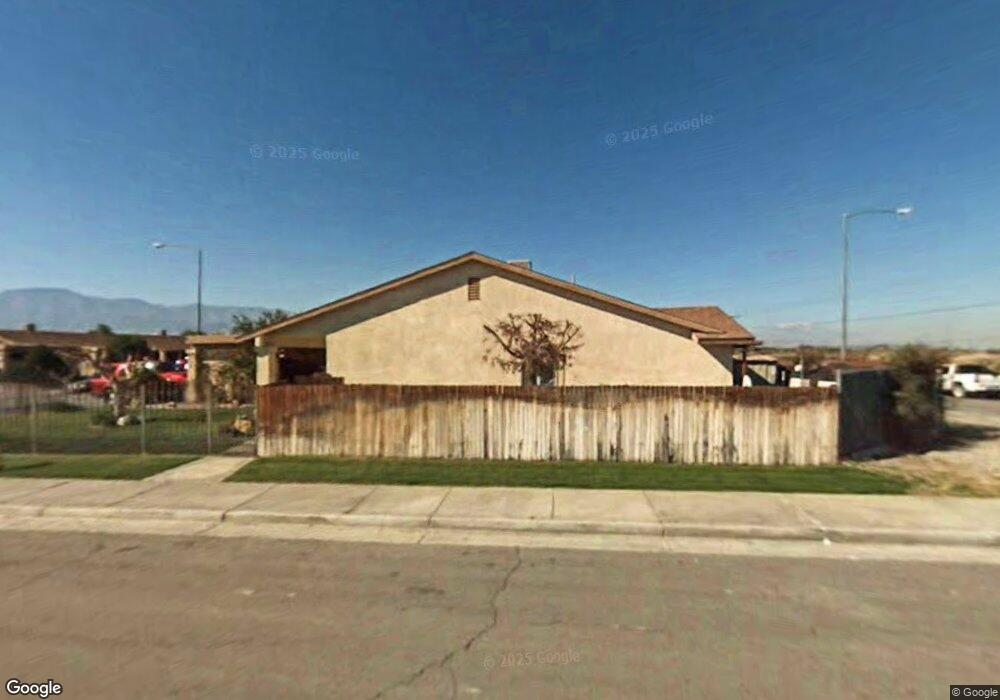
This home is located at 91070 Las Flores Way, Mecca, CA 92254 and is currently estimated at $299,954, approximately $205 per square foot. 91070 Las Flores Way is a home located in Riverside County with nearby schools including Mecca Elementary School, Toro Canyon Middle School, and Desert Mirage High School.
Ownership History
Date
Name
Owned For
Owner Type
Purchase Details
Closed on
Aug 14, 1998
Sold by
Norwest Mtg Inc
Bought by
Duenas Jose Gerado and Elizarraras Martina Cruz
Current Estimated Value
Home Financials for this Owner
Home Financials are based on the most recent Mortgage that was taken out on this home.
Original Mortgage
$67,242
Outstanding Balance
$13,991
Interest Rate
6.89%
Mortgage Type
FHA
Estimated Equity
$285,963
Purchase Details
Closed on
May 27, 1998
Sold by
Rodriguez Jose L and Murillo Maria
Bought by
Norwest Mtg Inc
Purchase Details
Closed on
Apr 22, 1996
Sold by
E G Williams Development
Bought by
Rodriguez Jose Sl and Murillo Maria L
Home Financials for this Owner
Home Financials are based on the most recent Mortgage that was taken out on this home.
Original Mortgage
$71,950
Interest Rate
7.96%
Mortgage Type
Purchase Money Mortgage
Create a Home Valuation Report for This Property
The Home Valuation Report is an in-depth analysis detailing your home's value as well as a comparison with similar homes in the area
Home Values in the Area
Average Home Value in this Area
Purchase History
| Date | Buyer | Sale Price | Title Company |
|---|---|---|---|
| Duenas Jose Gerado | $67,500 | Ati Title | |
| Norwest Mtg Inc | $65,000 | Chicago Title | |
| Rodriguez Jose Sl | $72,000 | Fidelity National Title Ins |
Source: Public Records
Mortgage History
| Date | Status | Borrower | Loan Amount |
|---|---|---|---|
| Open | Duenas Jose Gerado | $67,242 | |
| Previous Owner | Rodriguez Jose Sl | $71,950 |
Source: Public Records
Tax History Compared to Growth
Tax History
| Year | Tax Paid | Tax Assessment Tax Assessment Total Assessment is a certain percentage of the fair market value that is determined by local assessors to be the total taxable value of land and additions on the property. | Land | Improvement |
|---|---|---|---|---|
| 2025 | $2,119 | $105,785 | $23,497 | $82,288 |
| 2023 | $2,119 | $101,680 | $22,586 | $79,094 |
| 2022 | $2,012 | $99,688 | $22,144 | $77,544 |
| 2021 | $1,948 | $97,734 | $21,710 | $76,024 |
| 2020 | $1,927 | $96,733 | $21,488 | $75,245 |
| 2019 | $1,898 | $94,837 | $21,067 | $73,770 |
| 2018 | $1,866 | $92,978 | $20,655 | $72,323 |
| 2017 | $1,883 | $91,155 | $20,250 | $70,905 |
| 2016 | $1,655 | $89,368 | $19,853 | $69,515 |
| 2015 | $1,605 | $88,027 | $19,555 | $68,472 |
| 2014 | $1,599 | $86,305 | $19,173 | $67,132 |
Source: Public Records
Map
Nearby Homes
- 90575 64th Ave
- 0 Dale Kiler Rd
- 0 Grapefruit Blvd
- 00 Grapefruit Blvd
- 91605 3rd St
- 70140 Johnson St
- 66th and Lincoln Vacant Land
- 63325 Buchanan St
- 0 Unit 219103508
- 0 Hwy 111 & Ave 68 Unit 219090434
- 91666 62nd Ave
- 0 Nwc Pierce St & Ave 64 Unit 219106942
- 88751 64th Ave
- 0 Ave 63 & W Pierce St Unit 219106924
- 88821 62nd Ave
- 0 Na Unit 219128030DA
- 0 Unit 219123225DA
- 1 68th Ave
- 0 Nwc Hwy 111 & Grant St Unit 219103501
- 0 Grant St & Hammond Rd
- 91060 Las Flores Way
- 91050 Las Flores Way
- 91125 Las Flores Way
- 91115 Las Flores Way
- 91040 Las Flores Way
- 91075 Las Flores Way
- 91105 Las Flores Way
- 91065 Las Flores Way
- 91085 Las Flores Way
- 91055 Las Flores Way
- 91030 Las Flores Way
- 91095 Las Flores Way
- 91045 Las Flores Way
- 64012 Las Sonrisas Way
- 91020 Las Flores Way
- 64032 Las Sonrisas Way
- 91035 Las Flores Way
- 91130 Las Serenas Way
- 91082 Fuchsia Ct
- 91082 Fushia Ct