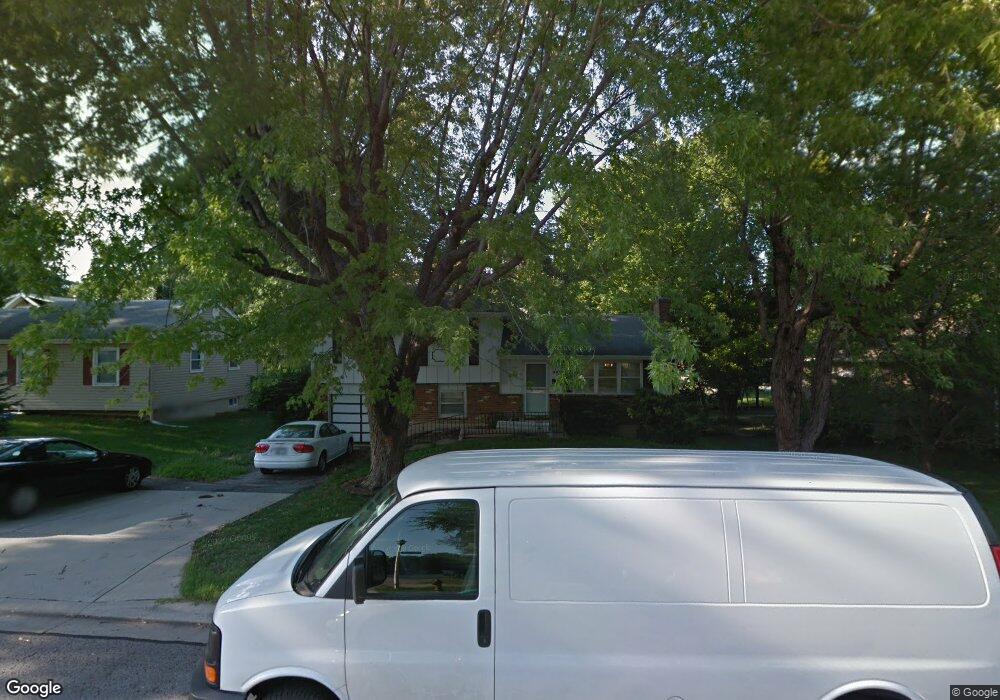
9108 W 80th St Overland Park, KS 66204
Elmhurst NeighborhoodEstimated Value: $312,000 - $343,000
4
Beds
2
Baths
1,104
Sq Ft
$292/Sq Ft
Est. Value
About This Home
This home is located at 9108 W 80th St, Overland Park, KS 66204 and is currently estimated at $321,995, approximately $291 per square foot. 9108 W 80th St is a home located in Johnson County with nearby schools including Comanche Elementary School, Westridge Middle School, and Shawnee Mission West High School.
Ownership History
Date
Name
Owned For
Owner Type
Purchase Details
Closed on
Feb 7, 2018
Sold by
Chinchilla Jose M and Chinchilla Laura C
Bought by
Chinchilla Naomi Marina
Current Estimated Value
Purchase Details
Closed on
Sep 27, 2006
Sold by
Carranza Ilsa
Bought by
Chinchilla Jose M and Chinchilla Laura C
Home Financials for this Owner
Home Financials are based on the most recent Mortgage that was taken out on this home.
Original Mortgage
$111,200
Interest Rate
6.51%
Mortgage Type
New Conventional
Purchase Details
Closed on
Jul 24, 2005
Sold by
Donelson Naomi and Smith Deborah S
Bought by
Carranza Lisa
Home Financials for this Owner
Home Financials are based on the most recent Mortgage that was taken out on this home.
Original Mortgage
$118,750
Interest Rate
9.75%
Mortgage Type
Adjustable Rate Mortgage/ARM
Create a Home Valuation Report for This Property
The Home Valuation Report is an in-depth analysis detailing your home's value as well as a comparison with similar homes in the area
Home Values in the Area
Average Home Value in this Area
Purchase History
| Date | Buyer | Sale Price | Title Company |
|---|---|---|---|
| Chinchilla Naomi Marina | -- | None Available | |
| Chinchilla Jose M | -- | Capital Title Agency Inc | |
| Carranza Lisa | -- | Kansas City Title |
Source: Public Records
Mortgage History
| Date | Status | Borrower | Loan Amount |
|---|---|---|---|
| Previous Owner | Chinchilla Jose M | $111,200 | |
| Previous Owner | Carranza Lisa | $118,750 |
Source: Public Records
Tax History Compared to Growth
Tax History
| Year | Tax Paid | Tax Assessment Tax Assessment Total Assessment is a certain percentage of the fair market value that is determined by local assessors to be the total taxable value of land and additions on the property. | Land | Improvement |
|---|---|---|---|---|
| 2024 | $3,025 | $31,682 | $6,941 | $24,741 |
| 2023 | $2,928 | $30,061 | $6,941 | $23,120 |
| 2022 | $2,693 | $27,853 | $6,941 | $20,912 |
| 2021 | $2,693 | $24,817 | $5,789 | $19,028 |
| 2020 | $2,384 | $23,402 | $5,032 | $18,370 |
| 2019 | $2,042 | $20,079 | $3,355 | $16,724 |
| 2018 | $1,970 | $19,297 | $3,355 | $15,942 |
| 2017 | $1,811 | $17,469 | $3,355 | $14,114 |
| 2016 | $1,709 | $16,227 | $3,355 | $12,872 |
| 2015 | $1,596 | $15,491 | $3,355 | $12,136 |
| 2013 | -- | $15,318 | $3,355 | $11,963 |
Source: Public Records
Map
Nearby Homes
- 7909 Grandview St
- 8037 Grandview Ln
- 7859 Kessler Ln
- 8915 W 81st St
- 9312 W 81st Terrace
- 8808 W 81st Terrace
- 9317 W 82nd St
- 8201 Antioch Rd
- 7923 Hadley St
- 8708 W 76th Terrace
- 8113 Hadley St
- 8401 W 77th St
- 7649 Mackey St
- 8330 Connell St
- 8608 W 84th St
- 8101 Goodman St
- 9817 W 83rd Terrace
- 7522 Mackey St
- 8314 Hadley St
- 8602 W 84th Terrace
- 9116 W 80th St
- 9100 W 80th St
- 7932 Grandview St
- 9124 W 80th St
- 7928 Grandview St
- 7936 Grandview St
- 8001 Grandview Ln
- 8000 Grandview Ln
- 9006 W 80th St
- 8007 Grandview Ln
- 7924 Grandview St
- 7923 Grandview St
- 8006 Grandview Ln
- 7935 Kessler St
- 7937 Kessler St
- 7931 Kessler St
- 7921 Grandview St
- 9021 W 80th St
- 7929 Kessler St
- 9004 W 80th St