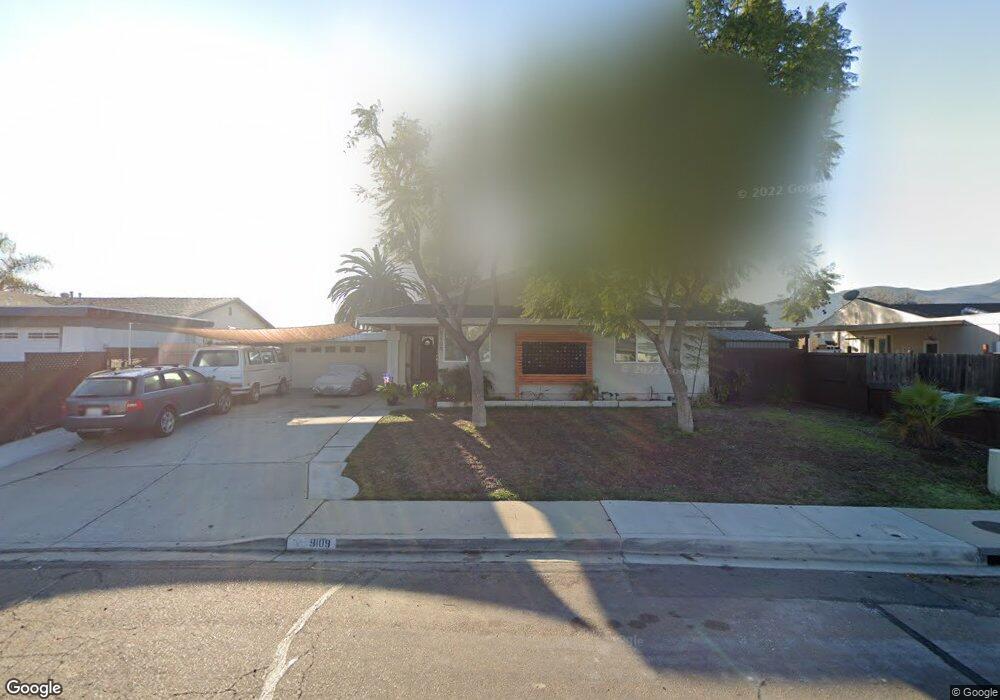
9109 Inverness Rd Santee, CA 92071
East Elliott NeighborhoodEstimated Value: $931,510 - $942,000
3
Beds
2
Baths
1,522
Sq Ft
$615/Sq Ft
Est. Value
About This Home
This home is located at 9109 Inverness Rd, Santee, CA 92071 and is currently estimated at $936,378, approximately $615 per square foot. 9109 Inverness Rd is a home located in San Diego County with nearby schools including Carlton Oaks Elementary School and West Hills High School.
Ownership History
Date
Name
Owned For
Owner Type
Purchase Details
Closed on
Jan 30, 2018
Sold by
Tcr Holdings 1 Llc
Bought by
Quiros Frederick B and Quiros Cassie B
Current Estimated Value
Home Financials for this Owner
Home Financials are based on the most recent Mortgage that was taken out on this home.
Original Mortgage
$539,000
Outstanding Balance
$456,025
Interest Rate
3.95%
Mortgage Type
New Conventional
Estimated Equity
$480,353
Purchase Details
Closed on
Apr 7, 2017
Sold by
Black Jessica
Bought by
Tcr Holdings 1 Llc
Home Financials for this Owner
Home Financials are based on the most recent Mortgage that was taken out on this home.
Original Mortgage
$64,500
Interest Rate
4.02%
Mortgage Type
Credit Line Revolving
Purchase Details
Closed on
Jan 31, 2014
Sold by
Gibbens Richard William and Gibbens Richard W
Bought by
Gibbens Richard William
Home Financials for this Owner
Home Financials are based on the most recent Mortgage that was taken out on this home.
Original Mortgage
$387,148
Interest Rate
4.47%
Mortgage Type
VA
Purchase Details
Closed on
Jan 25, 1990
Purchase Details
Closed on
May 11, 1989
Purchase Details
Closed on
Jun 10, 1987
Create a Home Valuation Report for This Property
The Home Valuation Report is an in-depth analysis detailing your home's value as well as a comparison with similar homes in the area
Home Values in the Area
Average Home Value in this Area
Purchase History
| Date | Buyer | Sale Price | Title Company |
|---|---|---|---|
| Quiros Frederick B | $639,000 | Chicago Title Company Sd | |
| Tcr Holdings 1 Llc | $430,000 | Chicago Title Company Sd | |
| Gibbens Richard William | -- | None Available | |
| -- | $130,000 | -- | |
| -- | $138,000 | -- | |
| -- | $116,000 | -- |
Source: Public Records
Mortgage History
| Date | Status | Borrower | Loan Amount |
|---|---|---|---|
| Open | Quiros Frederick B | $539,000 | |
| Previous Owner | Tcr Holdings 1 Llc | $64,500 | |
| Previous Owner | Gibbens Richard William | $387,148 |
Source: Public Records
Tax History Compared to Growth
Tax History
| Year | Tax Paid | Tax Assessment Tax Assessment Total Assessment is a certain percentage of the fair market value that is determined by local assessors to be the total taxable value of land and additions on the property. | Land | Improvement |
|---|---|---|---|---|
| 2025 | $8,586 | $727,065 | $338,170 | $388,895 |
| 2024 | $8,586 | $712,810 | $331,540 | $381,270 |
| 2023 | $8,324 | $698,835 | $325,040 | $373,795 |
| 2022 | $8,267 | $685,133 | $318,667 | $366,466 |
| 2021 | $8,155 | $671,700 | $312,419 | $359,281 |
| 2020 | $8,054 | $664,814 | $309,216 | $355,598 |
| 2019 | $7,770 | $651,779 | $303,153 | $348,626 |
| 2018 | $5,168 | $430,000 | $200,000 | $230,000 |
| 2017 | $2,482 | $206,054 | $71,323 | $134,731 |
| 2016 | $2,406 | $202,015 | $69,925 | $132,090 |
| 2015 | $2,374 | $198,981 | $68,875 | $130,106 |
| 2014 | $2,325 | $195,084 | $67,526 | $127,558 |
Source: Public Records
Map
Nearby Homes
- 9058 Inverness Rd
- 9256 Allano Way
- 8609 Dunwoodie Rd
- 8069 Mission George Rd Unit 1
- 8301 Mission Gorge Rd
- 8301 Mission Gorge Rd Unit 169
- 8301 Mission Gorge Rd Unit 208
- 8301 Mission Gorge Rd Unit 282
- 8301 Mission Gorge Rd Unit 248
- 8301 Mission Gorge Rd Unit 325
- 8301 Mission Gorge Rd Unit 256
- 8301 Mission Gorge Rd Unit 382
- 8301 Mission Gorge Rd Unit 351
- 8301 Mission Gorge Rd Unit 331
- 8301 Mission Gorge Rd Unit 253
- 8301 Mission Gorge Rd Unit 286
- 8301 Mission Gorge Rd Unit 246
- 8530 Cherub Ct
- 8732 Crossway Ct Unit 33
- 8732 Crossway Ct Unit 36
- 9111 Inverness Rd
- 9105 Inverness Rd
- 9115 Inverness Rd
- 9101 Inverness Rd
- 9106 Inverness Rd
- 9102 Inverness Rd
- 9119 Inverness Rd
- 9110 Inverness Rd
- 9081 Inverness Rd
- 9114 Inverness Rd
- 9121 Inverness Rd
- 9077 Inverness Rd
- 9118 Inverness Rd
- 9080 Inverness Rd
- 9215 Massot Ave
- 9126 Inverness Rd
- 9125 Inverness Rd
- 9122 Inverness Rd
- 9076 Inverness Rd
- 9073 Inverness Rd