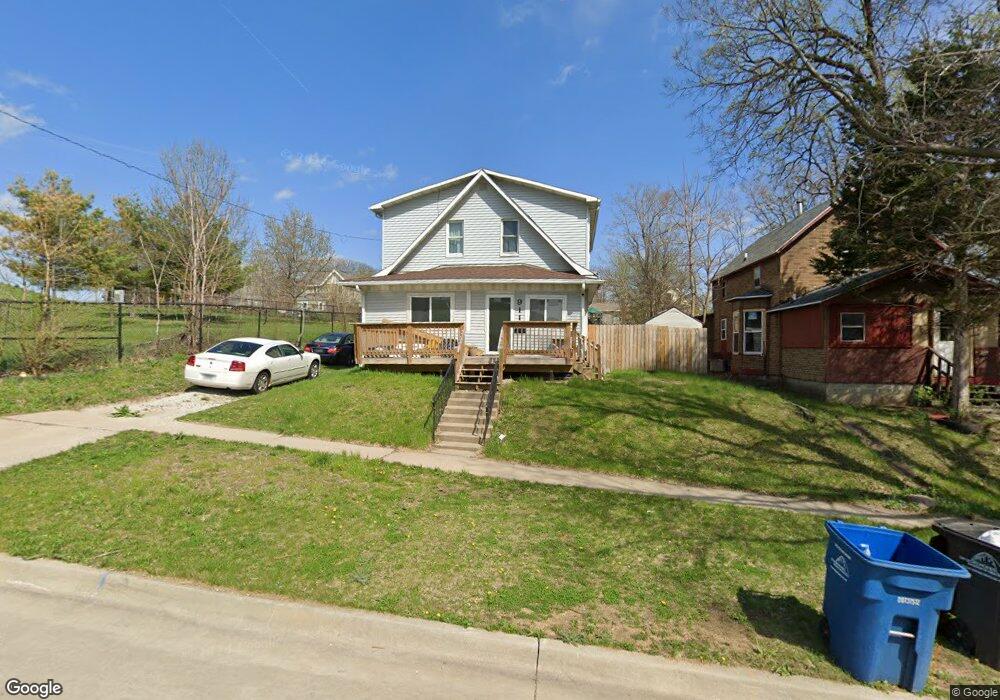
911 26th St Des Moines, IA 50312
Woodland Heights NeighborhoodEstimated Value: $150,000 - $212,823
Studio
2
Baths
1,532
Sq Ft
$125/Sq Ft
Est. Value
About This Home
This home is located at 911 26th St, Des Moines, IA 50312 and is currently estimated at $191,206, approximately $124 per square foot. 911 26th St is a home located in Polk County with nearby schools including Greenwood Elementary School, Callanan Middle School, and Roosevelt High School.
Ownership History
Date
Name
Owned For
Owner Type
Purchase Details
Closed on
Jun 12, 2018
Sold by
Weinstein Frank E
Bought by
Mora Arreola Jose Alejandro and Mora Maria Del Carmen
Current Estimated Value
Home Financials for this Owner
Home Financials are based on the most recent Mortgage that was taken out on this home.
Original Mortgage
$81,530
Outstanding Balance
$47,521
Interest Rate
3.87%
Mortgage Type
Adjustable Rate Mortgage/ARM
Estimated Equity
$143,685
Purchase Details
Closed on
May 15, 2013
Sold by
Weinstein Frank E
Bought by
Arreola Jose Alejandro Mora and Mora Maria Del Carmen
Home Financials for this Owner
Home Financials are based on the most recent Mortgage that was taken out on this home.
Original Mortgage
$85,000
Interest Rate
3.39%
Mortgage Type
Seller Take Back
Purchase Details
Closed on
Feb 14, 2011
Sold by
Weinstein Frank E
Bought by
Vandermark Misty
Home Financials for this Owner
Home Financials are based on the most recent Mortgage that was taken out on this home.
Original Mortgage
$83,000
Interest Rate
4.76%
Mortgage Type
Seller Take Back
Purchase Details
Closed on
Oct 1, 2007
Sold by
Weinstein Frank E
Bought by
Baires Gloria
Home Financials for this Owner
Home Financials are based on the most recent Mortgage that was taken out on this home.
Original Mortgage
$84,000
Interest Rate
6.49%
Mortgage Type
Purchase Money Mortgage
Purchase Details
Closed on
Jan 10, 2005
Sold by
Cotract Exchange Corp
Bought by
Weinstein Frank E
Purchase Details
Closed on
Oct 28, 2004
Sold by
Contract Exchange Corp
Bought by
Munoz Salvador Daniel and Gonzalez Maria Lourdes
Home Financials for this Owner
Home Financials are based on the most recent Mortgage that was taken out on this home.
Original Mortgage
$74,900
Interest Rate
8.5%
Mortgage Type
Seller Take Back
Purchase Details
Closed on
May 4, 2004
Sold by
Bank One Na
Bought by
Contract Exchange Corp
Purchase Details
Closed on
Jul 31, 2003
Sold by
Woods Desi L and Woods Gail L
Bought by
Bank One Na
Create a Home Valuation Report for This Property
The Home Valuation Report is an in-depth analysis detailing your home's value as well as a comparison with similar homes in the area
Home Values in the Area
Average Home Value in this Area
Purchase History
| Date | Buyer | Sale Price | Title Company |
|---|---|---|---|
| Mora Arreola Jose Alejandro | $89,000 | None Available | |
| Arreola Jose Alejandro Mora | $89,000 | None Available | |
| Vandermark Misty | $88,000 | None Available | |
| Baires Gloria | $86,000 | None Available | |
| Weinstein Frank E | -- | None Available | |
| Munoz Salvador Daniel | $79,900 | -- | |
| Contract Exchange Corp | $35,000 | -- | |
| Bank One Na | $43,200 | -- |
Source: Public Records
Mortgage History
| Date | Status | Borrower | Loan Amount |
|---|---|---|---|
| Open | Mora Arreola Jose Alejandro | $81,530 | |
| Previous Owner | Arreola Jose Alejandro Mora | $85,000 | |
| Previous Owner | Vandermark Misty | $83,000 | |
| Previous Owner | Baires Gloria | $84,000 | |
| Previous Owner | Munoz Salvador Daniel | $74,900 |
Source: Public Records
Tax History
| Year | Tax Paid | Tax Assessment Tax Assessment Total Assessment is a certain percentage of the fair market value that is determined by local assessors to be the total taxable value of land and additions on the property. | Land | Improvement |
|---|---|---|---|---|
| 2025 | $2,938 | $181,100 | $34,200 | $146,900 |
| 2024 | $2,938 | $159,800 | $30,100 | $129,700 |
| 2023 | $2,784 | $159,800 | $30,100 | $129,700 |
| 2022 | $2,760 | $127,000 | $24,500 | $102,500 |
| 2021 | $2,592 | $127,000 | $24,500 | $102,500 |
| 2020 | $2,688 | $112,500 | $21,900 | $90,600 |
| 2019 | $2,436 | $112,500 | $21,900 | $90,600 |
| 2018 | $2,408 | $99,200 | $19,100 | $80,100 |
| 2017 | $2,314 | $99,200 | $19,100 | $80,100 |
| 2016 | $2,250 | $94,100 | $18,000 | $76,100 |
| 2015 | $2,250 | $94,100 | $18,000 | $76,100 |
| 2014 | $2,024 | $84,900 | $16,200 | $68,700 |
Source: Public Records
Map
Nearby Homes
Your Personal Tour Guide
Ask me questions while you tour the home.