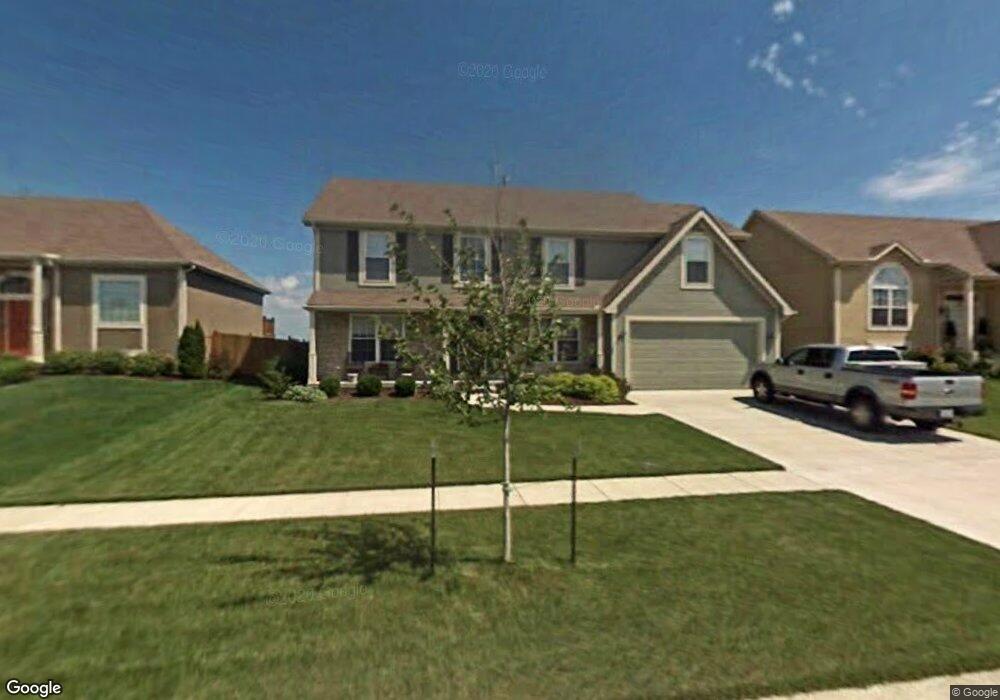
911 Allyssa Ct Lansing, KS 66043
Estimated Value: $384,000 - $406,000
4
Beds
3
Baths
2,700
Sq Ft
$147/Sq Ft
Est. Value
About This Home
This home is located at 911 Allyssa Ct, Lansing, KS 66043 and is currently estimated at $395,741, approximately $146 per square foot. 911 Allyssa Ct is a home located in Leavenworth County with nearby schools including Lansing Elementary School, Lansing Middle 6-8, and Lansing High 9-12.
Ownership History
Date
Name
Owned For
Owner Type
Purchase Details
Closed on
Jul 13, 2021
Sold by
Riley Michael
Bought by
Riley Angela and Onstott Nelson E
Current Estimated Value
Home Financials for this Owner
Home Financials are based on the most recent Mortgage that was taken out on this home.
Original Mortgage
$158,900
Outstanding Balance
$144,177
Interest Rate
2.9%
Mortgage Type
New Conventional
Estimated Equity
$251,564
Purchase Details
Closed on
Dec 14, 2009
Sold by
Evenson James L and Evenson Kimberly
Bought by
Collis David E and Collis Iris G
Home Financials for this Owner
Home Financials are based on the most recent Mortgage that was taken out on this home.
Original Mortgage
$237,500
Interest Rate
5.01%
Mortgage Type
New Conventional
Create a Home Valuation Report for This Property
The Home Valuation Report is an in-depth analysis detailing your home's value as well as a comparison with similar homes in the area
Home Values in the Area
Average Home Value in this Area
Purchase History
| Date | Buyer | Sale Price | Title Company |
|---|---|---|---|
| Riley Angela | -- | None Listed On Document | |
| Collis David E | $296,875 | Mccaffree-Short Title Co Inc |
Source: Public Records
Mortgage History
| Date | Status | Borrower | Loan Amount |
|---|---|---|---|
| Open | Riley Angela | $158,900 | |
| Previous Owner | Collis David E | $237,500 |
Source: Public Records
Tax History Compared to Growth
Tax History
| Year | Tax Paid | Tax Assessment Tax Assessment Total Assessment is a certain percentage of the fair market value that is determined by local assessors to be the total taxable value of land and additions on the property. | Land | Improvement |
|---|---|---|---|---|
| 2025 | $5,723 | $44,060 | $5,331 | $38,729 |
| 2024 | $5,519 | $42,364 | $5,331 | $37,033 |
| 2023 | $5,519 | $42,364 | $5,331 | $37,033 |
| 2022 | $5,307 | $38,513 | $3,328 | $35,185 |
| 2021 | $4,899 | $33,982 | $3,328 | $30,654 |
| 2020 | $4,538 | $30,992 | $3,328 | $27,664 |
| 2019 | $4,476 | $30,532 | $3,328 | $27,204 |
| 2018 | $4,370 | $29,831 | $3,328 | $26,503 |
| 2017 | $4,106 | $27,987 | $3,328 | $24,659 |
| 2016 | $4,067 | $27,710 | $3,328 | $24,382 |
| 2015 | $4,055 | $27,710 | $3,328 | $24,382 |
| 2014 | $3,803 | $26,542 | $3,328 | $23,214 |
Source: Public Records
Map
Nearby Homes
- 922 Southfork St
- 115 W Gilman Rd
- 722 Bittersweet Rd
- 624 S Bittersweet Ln
- 901 S Main St
- 811 4-H Rd
- 527 S Valley Dr
- 131 Rock Creek Loop
- 000 4-H Rd
- 875 Clearview Dr
- 1217 S Desoto Rd
- 705 Rock Creek Dr
- 506 1st Terrace
- 1221 S Desoto Rd
- 513 Forestglen Ln
- 833 Rock Creek Dr
- 202 S Main St
- 124 S Main St
- 102 S 3rd Ct
- 218 E Kay St
- 913 Allyssa Ct
- 909 Allyssa Ct
- 915 Allyssa Ct
- 907 Allyssa Ct
- 908 Allyssa Ct
- 917 Allyssa Ct
- 905 Allyssa Ct
- 931 Southfork St
- 1041 Allyssa Ct
- 906 Allyssa Ct
- 903 Allyssa Ct
- 900 Allyssa Ct
- 929 Southfork St
- 1043 Allyssa Ct
- 902 Allyssa Ct
- 904 Allyssa Ct
- 901 Allyssa Ct
- 934 Southfork St
- 925 Southfork St
- 1045 Allyssa Ct