911 Charleston Park Dr Seymour, TN 37865
Estimated Value: $707,759 - $733,000
3
Beds
4
Baths
3,590
Sq Ft
$201/Sq Ft
Est. Value
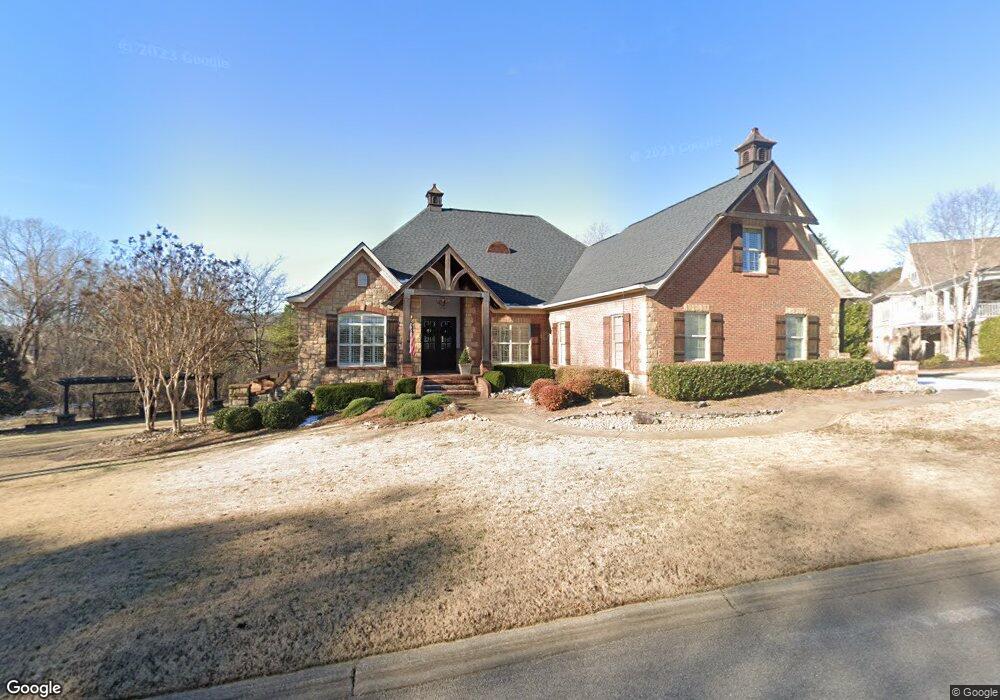
About This Home
This home is located at 911 Charleston Park Dr, Seymour, TN 37865 and is currently estimated at $720,380, approximately $200 per square foot. 911 Charleston Park Dr is a home located in Sevier County with nearby schools including Northview Elementary School, Catons Chapel Elementary School, and Jones Cove Elementary School.
Ownership History
Date
Name
Owned For
Owner Type
Purchase Details
Closed on
Dec 19, 2019
Sold by
Swaggerty Lisa
Bought by
Swaggerty Bradley W
Current Estimated Value
Home Financials for this Owner
Home Financials are based on the most recent Mortgage that was taken out on this home.
Original Mortgage
$482,000
Outstanding Balance
$425,783
Interest Rate
3.7%
Mortgage Type
New Conventional
Estimated Equity
$294,597
Purchase Details
Closed on
Mar 9, 2018
Sold by
Goddard Christopher Chandler and Goddard Maranda Sue
Bought by
Swaggerty Bradley
Home Financials for this Owner
Home Financials are based on the most recent Mortgage that was taken out on this home.
Original Mortgage
$446,250
Interest Rate
4.22%
Mortgage Type
New Conventional
Purchase Details
Closed on
Nov 28, 2006
Bought by
Goddard Christopher C and Goddard Maranda
Home Financials for this Owner
Home Financials are based on the most recent Mortgage that was taken out on this home.
Original Mortgage
$395,700
Interest Rate
6.29%
Create a Home Valuation Report for This Property
The Home Valuation Report is an in-depth analysis detailing your home's value as well as a comparison with similar homes in the area
Home Values in the Area
Average Home Value in this Area
Purchase History
| Date | Buyer | Sale Price | Title Company |
|---|---|---|---|
| Swaggerty Bradley W | -- | Title Professionals Llc | |
| Swaggerty Bradley | $525,000 | Broadway Title Inc | |
| Goddard Christopher C | $522,800 | -- |
Source: Public Records
Mortgage History
| Date | Status | Borrower | Loan Amount |
|---|---|---|---|
| Open | Swaggerty Bradley W | $482,000 | |
| Closed | Swaggerty Bradley | $446,250 | |
| Previous Owner | Goddard Christopher C | $395,700 |
Source: Public Records
Tax History Compared to Growth
Tax History
| Year | Tax Paid | Tax Assessment Tax Assessment Total Assessment is a certain percentage of the fair market value that is determined by local assessors to be the total taxable value of land and additions on the property. | Land | Improvement |
|---|---|---|---|---|
| 2025 | $1,994 | $134,700 | $12,500 | $122,200 |
| 2024 | $1,994 | $134,700 | $12,500 | $122,200 |
| 2023 | $1,994 | $134,700 | $0 | $0 |
| 2022 | $1,994 | $134,700 | $12,500 | $122,200 |
| 2021 | $1,994 | $134,700 | $12,500 | $122,200 |
| 2020 | $2,067 | $134,700 | $12,500 | $122,200 |
| 2019 | $2,067 | $111,150 | $13,125 | $98,025 |
| 2018 | $2,067 | $111,150 | $13,125 | $98,025 |
| 2017 | $2,067 | $111,150 | $13,125 | $98,025 |
| 2016 | $2,067 | $111,150 | $13,125 | $98,025 |
| 2015 | -- | $106,825 | $0 | $0 |
| 2014 | $1,741 | $106,835 | $0 | $0 |
Source: Public Records
Map
Nearby Homes
- Lot 34 Pioneer Dr
- 828 Berkley Ct
- 0 Golden Harvest Cir
- 0 Sundial Ln
- 816 Vigil Dr
- 850 Trinity View Cir
- 129 Huskey Cir
- 104 Huskey Cir
- 557 Smoky Valley Ln
- 865 Wade Rd
- 903 Amy St
- Lot 3 Boyds Creek Hwy
- 0 W Union Valley Rd
- 120 S Pitner Rd
- 1063 Boyds Creek Hwy
- 534 Boyds Creek Hwy
- 320 Chilhowee School Rd
- 121 N Shiloh Rd
- 1207 Fagley Dr
- 1108 Estates Dr
- 805 Berkley Ct
- 914 Charleston Park Dr
- 725 Pioneer Dr
- 922 Charleston Park Dr
- 806 Berkley Ct
- 0 Berkley Ct Unit 268412
- Lot 11 Berkley Ct
- 0 Berkley Ct
- LOT 10 Berkley Ct
- 815 Berkley Ct
- 809 Pioneer Dr
- 0 Charleston Park Dr Unit 225805
- 0 Charleston Park Dr Unit 1257127
- Lot 14 Charleston Park Dr
- Lot 13 Charleston Park Dr
- 0 Charleston Park Dr Unit 671530
- 0 Charleston Park Dr Unit 671527
- 0 Charleston Park Dr Unit 718251
- 0 Charleston Park Dr Unit 746293
- 0 Charleston Park Dr Unit 873472