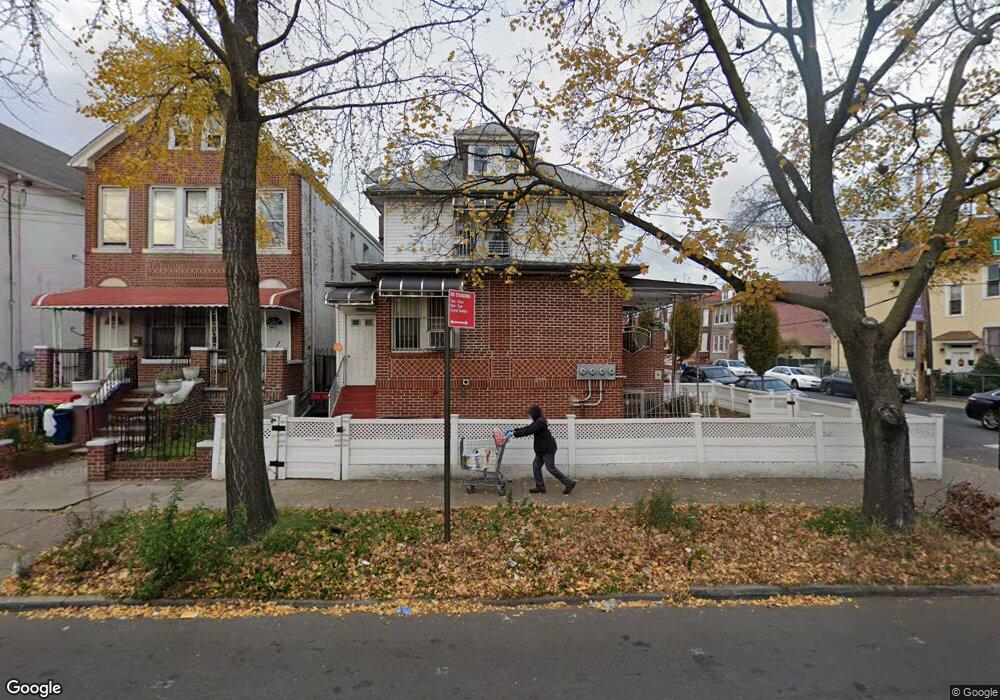
911 Linden Blvd Brooklyn, NY 11203
East Flatbush NeighborhoodEstimated Value: $1,103,000 - $1,193,000
--
Bed
--
Bath
3,864
Sq Ft
$295/Sq Ft
Est. Value
About This Home
This home is located at 911 Linden Blvd, Brooklyn, NY 11203 and is currently estimated at $1,141,267, approximately $295 per square foot. 911 Linden Blvd is a home located in Kings County with nearby schools including P.S. 268 Emma Lazarus, East Flatbush Community Research School, and Kings Elementary School.
Ownership History
Date
Name
Owned For
Owner Type
Purchase Details
Closed on
Aug 23, 2022
Sold by
Cephas David and Nmah-Cephas Theresa
Bought by
Nmah-Cephas David and Nmah-Cephas Theresa
Current Estimated Value
Purchase Details
Closed on
Oct 24, 2006
Sold by
Good Shepherd Services
Bought by
Cephas David and Nmah-Cephas Theresa
Home Financials for this Owner
Home Financials are based on the most recent Mortgage that was taken out on this home.
Original Mortgage
$498,400
Interest Rate
6.39%
Mortgage Type
Purchase Money Mortgage
Purchase Details
Closed on
Sep 29, 1999
Sold by
Sheltering Arms Childrens Service
Bought by
Good Shepherd Service
Home Financials for this Owner
Home Financials are based on the most recent Mortgage that was taken out on this home.
Original Mortgage
$97,500
Interest Rate
7%
Mortgage Type
Stand Alone First
Create a Home Valuation Report for This Property
The Home Valuation Report is an in-depth analysis detailing your home's value as well as a comparison with similar homes in the area
Home Values in the Area
Average Home Value in this Area
Purchase History
| Date | Buyer | Sale Price | Title Company |
|---|---|---|---|
| Nmah-Cephas David | -- | -- | |
| Cephas David | $623,000 | -- | |
| Good Shepherd Service | $197,500 | -- |
Source: Public Records
Mortgage History
| Date | Status | Borrower | Loan Amount |
|---|---|---|---|
| Previous Owner | Cephas David | $498,400 | |
| Previous Owner | Good Shepherd Service | $97,500 |
Source: Public Records
Tax History Compared to Growth
Tax History
| Year | Tax Paid | Tax Assessment Tax Assessment Total Assessment is a certain percentage of the fair market value that is determined by local assessors to be the total taxable value of land and additions on the property. | Land | Improvement |
|---|---|---|---|---|
| 2025 | $9,645 | $85,320 | $33,780 | $51,540 |
| 2024 | $9,645 | $69,780 | $33,780 | $36,000 |
| 2023 | $4,682 | $75,600 | $33,780 | $41,820 |
| 2022 | $4,530 | $70,260 | $33,780 | $36,480 |
| 2021 | $9,286 | $54,240 | $33,780 | $20,460 |
| 2020 | $4,419 | $45,240 | $33,780 | $11,460 |
| 2019 | $8,322 | $45,240 | $33,780 | $11,460 |
| 2018 | $8,098 | $41,184 | $24,254 | $16,930 |
| 2017 | $7,899 | $40,220 | $24,829 | $15,391 |
| 2016 | $7,276 | $37,944 | $26,973 | $10,971 |
| 2015 | $4,357 | $36,379 | $24,871 | $11,508 |
| 2014 | $4,357 | $34,320 | $28,140 | $6,180 |
Source: Public Records
Map
Nearby Homes