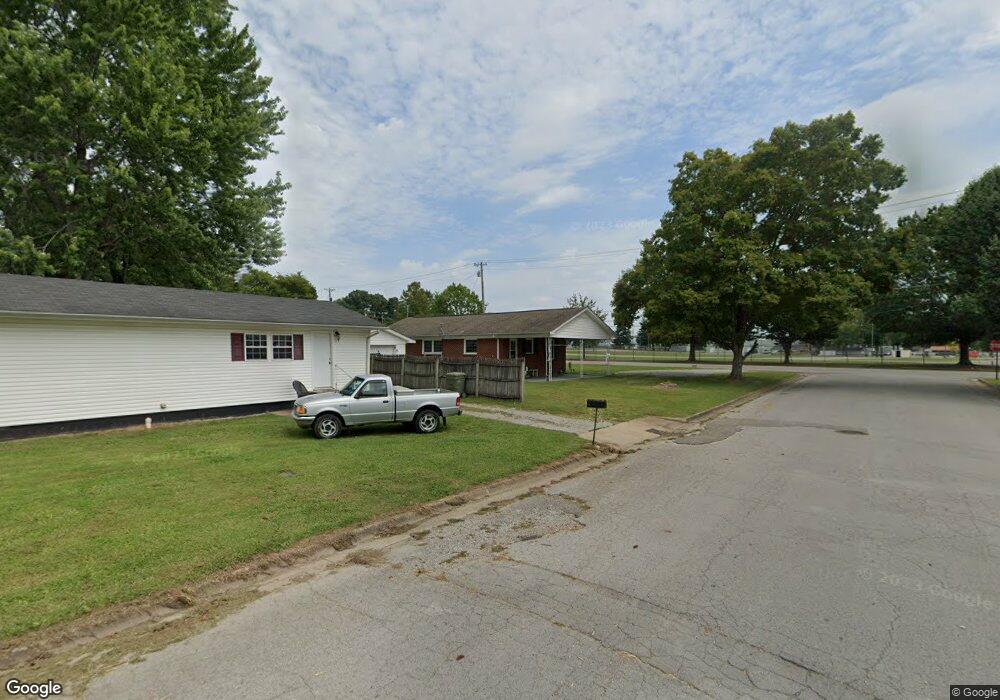
911 Mahr Ave Lawrenceburg, TN 38464
Estimated Value: $183,000 - $207,000
3
Beds
1
Bath
1,181
Sq Ft
$168/Sq Ft
Est. Value
About This Home
This home is located at 911 Mahr Ave, Lawrenceburg, TN 38464 and is currently estimated at $198,077, approximately $167 per square foot. 911 Mahr Ave is a home located in Lawrence County with nearby schools including Ingram Sowell Elementary School, Lawrenceburg Public Elementary School, and David Crockett Elementary School.
Ownership History
Date
Name
Owned For
Owner Type
Purchase Details
Closed on
Aug 2, 2018
Sold by
Lanning Tyler
Bought by
Laws Linda F
Current Estimated Value
Home Financials for this Owner
Home Financials are based on the most recent Mortgage that was taken out on this home.
Original Mortgage
$87,878
Outstanding Balance
$76,159
Interest Rate
4.5%
Mortgage Type
New Conventional
Estimated Equity
$121,918
Purchase Details
Closed on
Jul 31, 2012
Sold by
Weathers Donna
Bought by
Lanning Tyler
Home Financials for this Owner
Home Financials are based on the most recent Mortgage that was taken out on this home.
Original Mortgage
$70,345
Interest Rate
3.65%
Mortgage Type
Commercial
Purchase Details
Closed on
Feb 20, 2004
Sold by
Wanda Weathers
Bought by
Donna Weathers
Purchase Details
Closed on
Oct 14, 2003
Bought by
Weathers Donna
Purchase Details
Closed on
Aug 27, 1986
Bought by
Weathers Wanda
Create a Home Valuation Report for This Property
The Home Valuation Report is an in-depth analysis detailing your home's value as well as a comparison with similar homes in the area
Home Values in the Area
Average Home Value in this Area
Purchase History
| Date | Buyer | Sale Price | Title Company |
|---|---|---|---|
| Laws Linda F | $87,000 | None Available | |
| Lanning Tyler | $76,000 | -- | |
| Donna Weathers | $59,909 | -- | |
| Weathers Donna | $59,900 | -- | |
| Weathers Wanda | -- | -- |
Source: Public Records
Mortgage History
| Date | Status | Borrower | Loan Amount |
|---|---|---|---|
| Open | Laws Linda F | $87,878 | |
| Previous Owner | Lanning Tyler | $70,345 |
Source: Public Records
Tax History Compared to Growth
Tax History
| Year | Tax Paid | Tax Assessment Tax Assessment Total Assessment is a certain percentage of the fair market value that is determined by local assessors to be the total taxable value of land and additions on the property. | Land | Improvement |
|---|---|---|---|---|
| 2025 | $855 | $27,525 | $0 | $0 |
| 2024 | $855 | $27,525 | $3,125 | $24,400 |
| 2023 | $855 | $27,525 | $3,125 | $24,400 |
| 2022 | $855 | $27,525 | $3,125 | $24,400 |
| 2021 | $743 | $16,900 | $2,500 | $14,400 |
| 2020 | $743 | $16,900 | $2,500 | $14,400 |
| 2019 | $743 | $16,900 | $2,500 | $14,400 |
| 2018 | $743 | $16,900 | $2,500 | $14,400 |
| 2017 | $743 | $16,900 | $2,500 | $14,400 |
| 2016 | $743 | $16,900 | $2,500 | $14,400 |
| 2015 | $703 | $16,900 | $2,500 | $14,400 |
| 2014 | $691 | $16,600 | $2,500 | $14,100 |
Source: Public Records
Map
Nearby Homes