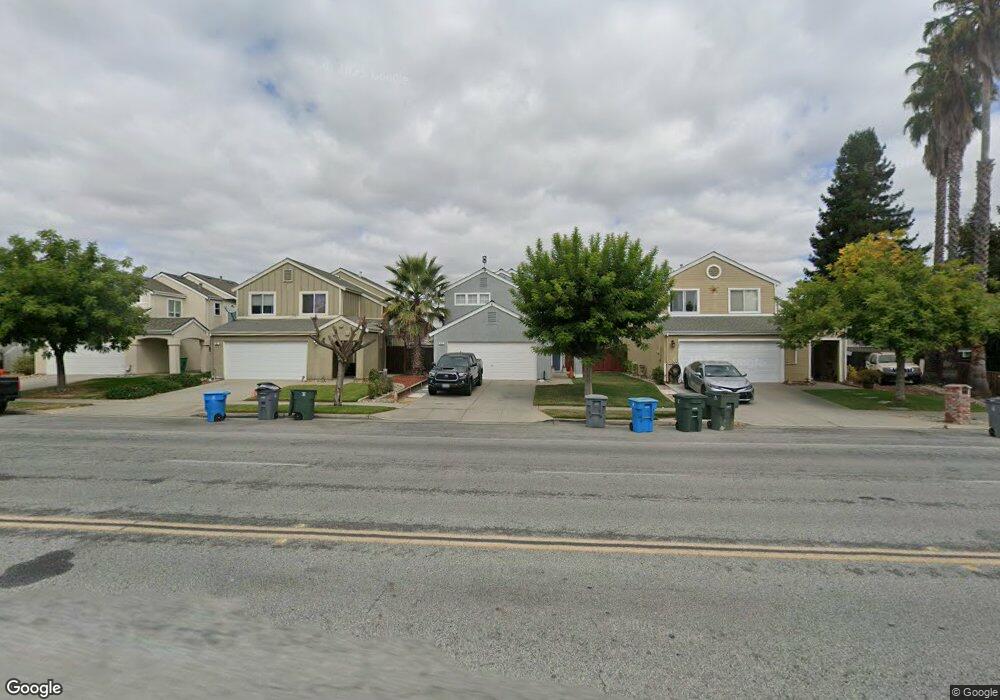
911 Mantelli Dr Gilroy, CA 95020
Las Animas NeighborhoodEstimated Value: $727,000 - $983,000
3
Beds
4
Baths
1,278
Sq Ft
$668/Sq Ft
Est. Value
About This Home
This home is located at 911 Mantelli Dr, Gilroy, CA 95020 and is currently estimated at $853,355, approximately $667 per square foot. 911 Mantelli Dr is a home located in Santa Clara County with nearby schools including Rod Kelley Elementary School, South Valley Middle School, and Solorsano Middle School.
Ownership History
Date
Name
Owned For
Owner Type
Purchase Details
Closed on
Oct 13, 2015
Sold by
Abdollahian Heshmat
Bought by
Abdollahian Heshmat
Current Estimated Value
Purchase Details
Closed on
Jul 17, 2008
Sold by
Abdollahian Mousa
Bought by
Abdollahian Heshmat
Purchase Details
Closed on
Jul 10, 2008
Sold by
The Bank Of New York
Bought by
Abdollahian Heshmat
Purchase Details
Closed on
Jun 10, 2008
Sold by
Mendoza Rosalba
Bought by
The Bank Of New York
Purchase Details
Closed on
May 17, 2006
Sold by
Hernandez Jose Salazar
Bought by
Mendoza Rosalba
Home Financials for this Owner
Home Financials are based on the most recent Mortgage that was taken out on this home.
Original Mortgage
$25,000
Interest Rate
6.52%
Mortgage Type
Stand Alone Second
Purchase Details
Closed on
Dec 22, 2004
Sold by
Pisarri Cristina
Bought by
Carmona Carlos and Mendoza Rosalba
Home Financials for this Owner
Home Financials are based on the most recent Mortgage that was taken out on this home.
Original Mortgage
$416,800
Interest Rate
5.12%
Mortgage Type
Purchase Money Mortgage
Purchase Details
Closed on
Dec 21, 2004
Sold by
Hernandez Jose Salazar
Bought by
Mendoza Rosalba
Home Financials for this Owner
Home Financials are based on the most recent Mortgage that was taken out on this home.
Original Mortgage
$416,800
Interest Rate
5.12%
Mortgage Type
Purchase Money Mortgage
Purchase Details
Closed on
Apr 30, 2003
Sold by
Mcclure Kirk A
Bought by
Pisarri Cristina
Home Financials for this Owner
Home Financials are based on the most recent Mortgage that was taken out on this home.
Original Mortgage
$47,000
Interest Rate
5.84%
Mortgage Type
Credit Line Revolving
Purchase Details
Closed on
Dec 6, 2000
Sold by
Gillespy Richard J and Gillespy Gerilyn R
Bought by
Pisarri Cristine
Home Financials for this Owner
Home Financials are based on the most recent Mortgage that was taken out on this home.
Original Mortgage
$292,000
Interest Rate
3.95%
Purchase Details
Closed on
Aug 21, 1996
Sold by
South County Housing Corp
Bought by
Gillespy Richard John and Gillespy Gerilyn Rose
Home Financials for this Owner
Home Financials are based on the most recent Mortgage that was taken out on this home.
Original Mortgage
$148,262
Interest Rate
8.23%
Mortgage Type
FHA
Create a Home Valuation Report for This Property
The Home Valuation Report is an in-depth analysis detailing your home's value as well as a comparison with similar homes in the area
Home Values in the Area
Average Home Value in this Area
Purchase History
| Date | Buyer | Sale Price | Title Company |
|---|---|---|---|
| Abdollahian Heshmat | -- | None Available | |
| Abdollahian Heshmat | -- | Chicago Title Co | |
| Abdollahian Heshmat | $325,000 | Chicago Title Co | |
| The Bank Of New York | $546,302 | None Available | |
| Mendoza Rosalba | -- | Alliance Title Company | |
| Mendoza Rosalba | $151,500 | Alliance Title Company | |
| Carmona Carlos | $521,000 | Chicago Title | |
| Mendoza Rosalba | -- | Chicago Title | |
| Carmona Carlos | -- | Chicago Title | |
| Pisarri Cristina | -- | Alliance Title Company | |
| Pisarri Cristine | $365,000 | Stewart Title | |
| Gillespy Richard John | -- | Old Republic Title Company | |
| Gillespy Richard John | $161,000 | Old Republic Title Company |
Source: Public Records
Mortgage History
| Date | Status | Borrower | Loan Amount |
|---|---|---|---|
| Previous Owner | Mendoza Rosalba | $25,000 | |
| Previous Owner | Mendoza Rosalba | $504,000 | |
| Previous Owner | Carmona Carlos | $416,800 | |
| Previous Owner | Pisarri Cristina | $47,000 | |
| Previous Owner | Pisarri Cristine | $292,000 | |
| Previous Owner | Gillespy Richard John | $148,262 | |
| Closed | Carmona Carlos | $100,000 |
Source: Public Records
Tax History
| Year | Tax Paid | Tax Assessment Tax Assessment Total Assessment is a certain percentage of the fair market value that is determined by local assessors to be the total taxable value of land and additions on the property. | Land | Improvement |
|---|---|---|---|---|
| 2025 | $5,159 | $418,506 | $167,401 | $251,105 |
| 2024 | $5,159 | $410,301 | $164,119 | $246,182 |
| 2023 | $5,128 | $402,256 | $160,901 | $241,355 |
| 2022 | $5,043 | $394,370 | $157,747 | $236,623 |
| 2021 | $5,020 | $386,638 | $154,654 | $231,984 |
| 2020 | $4,965 | $382,675 | $153,069 | $229,606 |
| 2019 | $4,920 | $375,172 | $150,068 | $225,104 |
| 2018 | $4,596 | $367,817 | $147,126 | $220,691 |
| 2017 | $4,691 | $360,606 | $144,242 | $216,364 |
| 2016 | $4,593 | $353,536 | $141,414 | $212,122 |
| 2015 | $4,335 | $348,226 | $139,290 | $208,936 |
| 2014 | $4,308 | $341,406 | $136,562 | $204,844 |
Source: Public Records
Map
Nearby Homes
- 735 Painter Ct
- 946 Martiri Ct
- 1206 Sycamore Ct
- 1165 Lerma Ln
- 1320 Heritage Way
- 1404 Casablanca Cir
- 1008 Primrose Ln
- 9400 Benbow Dr
- 8170 Westwood Dr Unit 22
- 1501 Welburn Ave
- 760 Welburn Ave
- 8120 Catalina Ct
- 803 Sunrise Dr
- 119 Farrell Ave
- 103 Farrell Ave
- 111 Farrell Ave
- 1610 Calabrese Way
- 401 Arnold Dr
- 1080 Sunrise Dr
- 1437 Briarberry Ln
Your Personal Tour Guide
Ask me questions while you tour the home.