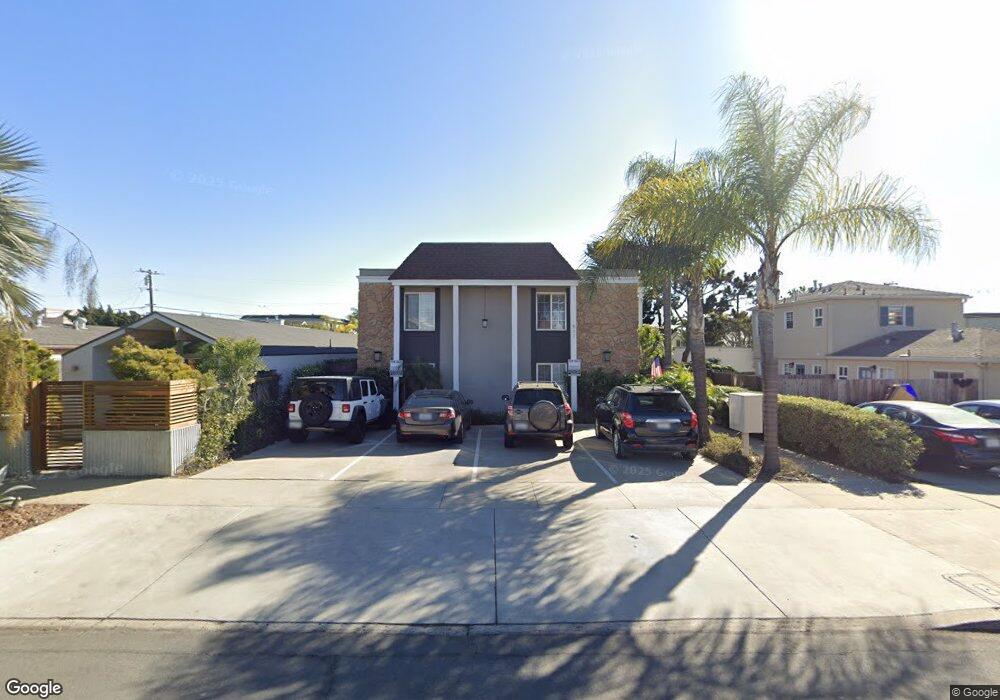
911 Missouri St Unit 5 San Diego, CA 92109
Pacific Beach NeighborhoodEstimated Value: $556,000 - $775,000
1
Bed
1
Bath
540
Sq Ft
$1,154/Sq Ft
Est. Value
About This Home
This home is located at 911 Missouri St Unit 5, San Diego, CA 92109 and is currently estimated at $622,903, approximately $1,153 per square foot. 911 Missouri St Unit 5 is a home located in San Diego County with nearby schools including Pacific Beach Elementary School, Pacific Beach Middle, and Mission Bay High School.
Ownership History
Date
Name
Owned For
Owner Type
Purchase Details
Closed on
Apr 12, 2011
Sold by
Alta Community Investment Iii Llc
Bought by
Quinn Stephen A
Current Estimated Value
Home Financials for this Owner
Home Financials are based on the most recent Mortgage that was taken out on this home.
Original Mortgage
$248,535
Outstanding Balance
$171,707
Interest Rate
4.83%
Mortgage Type
FHA
Estimated Equity
$451,196
Purchase Details
Closed on
Apr 1, 2010
Sold by
First Citizens Bank & Trust Company
Bought by
Alta Community Investment Iii Llc
Purchase Details
Closed on
Mar 26, 2010
Sold by
Federal Deposit Insurance Corporation
Bought by
First Citizens Bank & Trust Company
Purchase Details
Closed on
May 26, 2009
Sold by
Ck Sandstone Llc
Bought by
Temecula Valley Bank
Purchase Details
Closed on
May 14, 2008
Sold by
Ck Sandstone Llc
Bought by
Kerr F Corbitt and Kerr Kristen S
Create a Home Valuation Report for This Property
The Home Valuation Report is an in-depth analysis detailing your home's value as well as a comparison with similar homes in the area
Home Values in the Area
Average Home Value in this Area
Purchase History
| Date | Buyer | Sale Price | Title Company |
|---|---|---|---|
| Quinn Stephen A | $255,000 | Chicago Title Company | |
| Alta Community Investment Iii Llc | $1,500,000 | Chicago Title Co | |
| First Citizens Bank & Trust Company | -- | Chicago Title Co | |
| Temecula Valley Bank | $1,503,500 | Stewart Title | |
| Kerr F Corbitt | -- | Chicago Title Company |
Source: Public Records
Mortgage History
| Date | Status | Borrower | Loan Amount |
|---|---|---|---|
| Open | Quinn Stephen A | $248,535 |
Source: Public Records
Tax History Compared to Growth
Tax History
| Year | Tax Paid | Tax Assessment Tax Assessment Total Assessment is a certain percentage of the fair market value that is determined by local assessors to be the total taxable value of land and additions on the property. | Land | Improvement |
|---|---|---|---|---|
| 2025 | $3,879 | $326,688 | $255,675 | $71,013 |
| 2024 | $3,879 | $320,283 | $250,662 | $69,621 |
| 2023 | $3,792 | $314,004 | $245,748 | $68,256 |
| 2022 | $3,690 | $307,848 | $240,930 | $66,918 |
| 2021 | $3,663 | $301,812 | $236,206 | $65,606 |
| 2020 | $3,618 | $298,718 | $233,784 | $64,934 |
| 2019 | $3,552 | $292,861 | $229,200 | $63,661 |
| 2018 | $3,320 | $287,119 | $224,706 | $62,413 |
| 2017 | $3,240 | $281,490 | $220,300 | $61,190 |
| 2016 | $3,187 | $275,972 | $215,981 | $59,991 |
| 2015 | $3,139 | $271,827 | $212,737 | $59,090 |
| 2014 | $3,088 | $266,503 | $208,570 | $57,933 |
Source: Public Records
Map
Nearby Homes
- 911 Missouri St Unit 8
- 4667 Ocean Blvd Unit 106
- 835 Felspar St Week 6
- 4767 Ocean Blvd
- 4767 Ocean Blvd Unit 411
- 4944 Cass St Unit 1003
- 4944 Cass St Unit 409
- 4944 Cass St Unit 407
- 4475 Mission Blvd Unit 1
- 924 Hornblend St Unit 210
- 4918 Dawes St Unit 3
- 1135 Felspar St
- 4465 Ocean Blvd Unit 4
- 1220 Emerald St
- 866 Grand Ave
- 1210 Felspar St Unit 24
- 4975 Dawes St
- 1235 Wilbur Ave
- 5061 Mission Blvd
- 1118 Thomas Ave
- 911 Missouri St
- 911 Missouri St Unit 6
- 911 Missouri St Unit 7
- 911 Missouri St Unit 6
- 911 Missouri St Unit 4
- 911 Missouri St Unit 3
- 911 Missouri St Unit 2
- 911 Missouri St Unit 1
- 0 Missouri St Unit 180037341
- 917 Missouri St
- 4725 Bayard St Unit 27
- 921 Missouri St Unit 23
- 4737 Bayard St Unit 41
- 925 Missouri St Unit 27
- 929 Missouri St Unit 31
- 910 Diamond St Unit 14
- 933 Missouri St Unit 39
- 920 Diamond St
- 902 Diamond St Unit 8
- 933-39 Missouri St