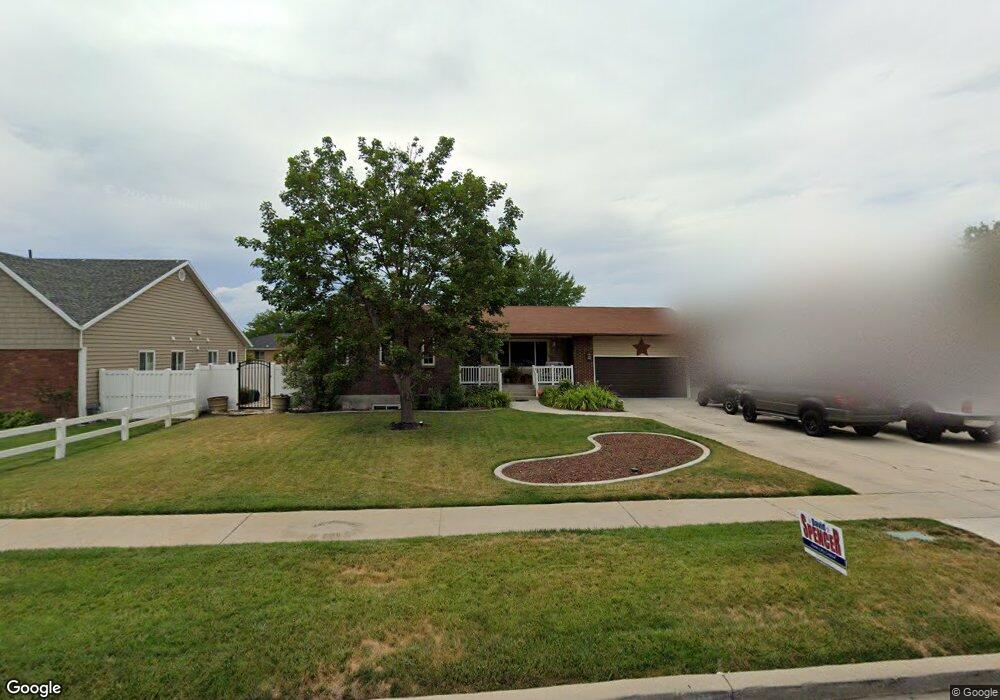
911 N 800 E Orem, UT 84097
SCERA NeighborhoodEstimated Value: $587,000 - $706,000
6
Beds
4
Baths
3,133
Sq Ft
$204/Sq Ft
Est. Value
About This Home
This home is located at 911 N 800 E, Orem, UT 84097 and is currently estimated at $637,609, approximately $203 per square foot. 911 N 800 E is a home located in Utah County with nearby schools including Centennial Elementary, Lakeridge Jr High School, and Orem High School.
Ownership History
Date
Name
Owned For
Owner Type
Purchase Details
Closed on
Jun 10, 2005
Sold by
Mcpherson James O and Mcpherson Kelly L
Bought by
Durfey Scott and Durfey Debra
Current Estimated Value
Home Financials for this Owner
Home Financials are based on the most recent Mortgage that was taken out on this home.
Original Mortgage
$36,580
Interest Rate
5.72%
Mortgage Type
Stand Alone Second
Purchase Details
Closed on
Oct 3, 2001
Sold by
Lucas Shawn
Bought by
Mcpherson James O and Mcpherson Kelly L
Home Financials for this Owner
Home Financials are based on the most recent Mortgage that was taken out on this home.
Original Mortgage
$116,000
Interest Rate
6.9%
Purchase Details
Closed on
Dec 22, 1997
Sold by
Christensen Janice M
Bought by
Lucas Shawn
Home Financials for this Owner
Home Financials are based on the most recent Mortgage that was taken out on this home.
Original Mortgage
$127,250
Interest Rate
7.23%
Mortgage Type
Seller Take Back
Create a Home Valuation Report for This Property
The Home Valuation Report is an in-depth analysis detailing your home's value as well as a comparison with similar homes in the area
Home Values in the Area
Average Home Value in this Area
Purchase History
| Date | Buyer | Sale Price | Title Company |
|---|---|---|---|
| Durfey Scott | -- | Equity Title | |
| Mcpherson James O | -- | Sundance Title Ins Agency | |
| Lucas Shawn | -- | -- |
Source: Public Records
Mortgage History
| Date | Status | Borrower | Loan Amount |
|---|---|---|---|
| Closed | Durfey Scott | $36,580 | |
| Previous Owner | Mcpherson James O | $116,000 | |
| Previous Owner | Lucas Shawn | $127,250 | |
| Closed | Mcpherson James O | $21,750 |
Source: Public Records
Tax History
| Year | Tax Paid | Tax Assessment Tax Assessment Total Assessment is a certain percentage of the fair market value that is determined by local assessors to be the total taxable value of land and additions on the property. | Land | Improvement |
|---|---|---|---|---|
| 2025 | $2,416 | $324,720 | -- | -- |
| 2024 | $2,416 | $295,405 | $0 | $0 |
| 2023 | $2,216 | $291,280 | $0 | $0 |
| 2022 | $2,295 | $292,270 | $0 | $0 |
| 2021 | $1,973 | $380,500 | $144,800 | $235,700 |
| 2020 | $1,830 | $346,900 | $115,800 | $231,100 |
| 2019 | $1,652 | $325,500 | $104,900 | $220,600 |
| 2018 | $1,604 | $302,100 | $101,300 | $200,800 |
| 2017 | $1,601 | $161,480 | $0 | $0 |
| 2016 | $1,495 | $139,040 | $0 | $0 |
| 2015 | $1,527 | $134,310 | $0 | $0 |
| 2014 | $1,445 | $126,555 | $0 | $0 |
Source: Public Records
Map
Nearby Homes
Your Personal Tour Guide
Ask me questions while you tour the home.