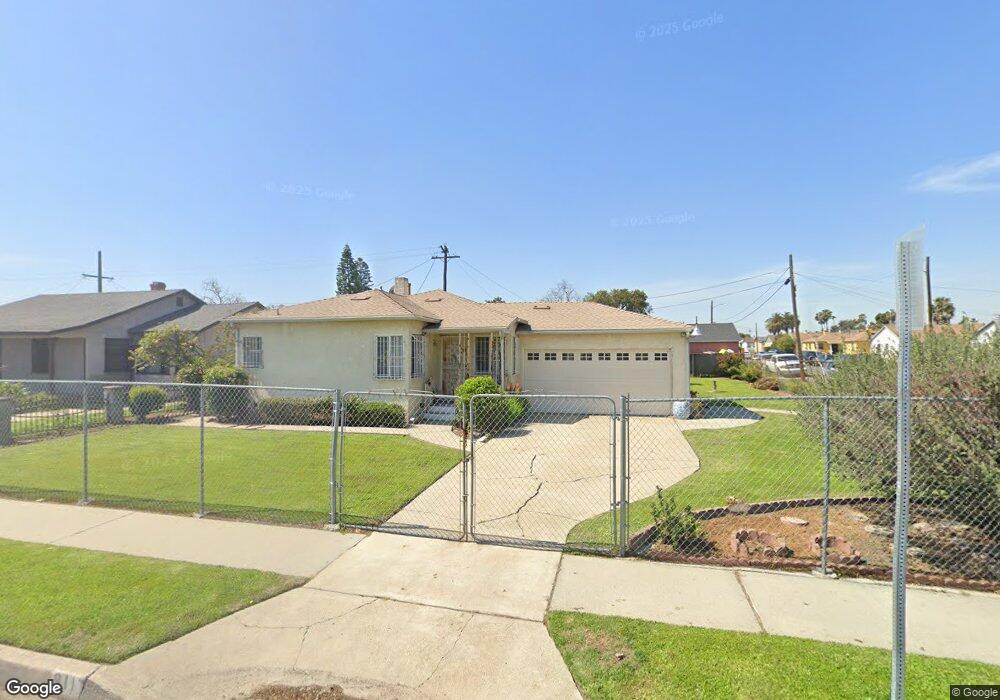
911 N Dwight Ave Compton, CA 90220
Estimated Value: $554,114 - $692,000
2
Beds
1
Bath
835
Sq Ft
$750/Sq Ft
Est. Value
About This Home
This home is located at 911 N Dwight Ave, Compton, CA 90220 and is currently estimated at $626,279, approximately $750 per square foot. 911 N Dwight Ave is a home located in Los Angeles County with nearby schools including Tibby Elementary School, Enterprise Middle School, and Compton High School.
Ownership History
Date
Name
Owned For
Owner Type
Purchase Details
Closed on
Jun 16, 1998
Sold by
Curry Temple Cdc
Bought by
Dorsaint Karen A Stewart
Current Estimated Value
Home Financials for this Owner
Home Financials are based on the most recent Mortgage that was taken out on this home.
Original Mortgage
$123,524
Outstanding Balance
$24,626
Interest Rate
7.01%
Mortgage Type
FHA
Estimated Equity
$601,653
Purchase Details
Closed on
Oct 20, 1997
Sold by
Hud
Bought by
Curry Temple Cdc
Home Financials for this Owner
Home Financials are based on the most recent Mortgage that was taken out on this home.
Original Mortgage
$83,525
Interest Rate
7.16%
Mortgage Type
FHA
Purchase Details
Closed on
May 6, 1997
Sold by
Harbourton Mtg Co Lp
Bought by
Hud
Purchase Details
Closed on
Feb 6, 1997
Sold by
Henry Ann and Sampson Gregory
Bought by
Harbourton Mtg Co Lp
Create a Home Valuation Report for This Property
The Home Valuation Report is an in-depth analysis detailing your home's value as well as a comparison with similar homes in the area
Home Values in the Area
Average Home Value in this Area
Purchase History
| Date | Buyer | Sale Price | Title Company |
|---|---|---|---|
| Dorsaint Karen A Stewart | $125,000 | Commonwealth Title | |
| Curry Temple Cdc | $59,000 | -- | |
| Hud | -- | Benefit Land Title Ins Co | |
| Harbourton Mtg Co Lp | $71,147 | Benefit Land Title Ins Co |
Source: Public Records
Mortgage History
| Date | Status | Borrower | Loan Amount |
|---|---|---|---|
| Open | Dorsaint Karen A Stewart | $123,524 | |
| Previous Owner | Curry Temple Cdc | $83,525 |
Source: Public Records
Tax History Compared to Growth
Tax History
| Year | Tax Paid | Tax Assessment Tax Assessment Total Assessment is a certain percentage of the fair market value that is determined by local assessors to be the total taxable value of land and additions on the property. | Land | Improvement |
|---|---|---|---|---|
| 2025 | $3,970 | $195,938 | $99,224 | $96,714 |
| 2024 | $3,970 | $192,097 | $97,279 | $94,818 |
| 2023 | $3,917 | $188,331 | $95,372 | $92,959 |
| 2022 | $4,023 | $184,639 | $93,502 | $91,137 |
| 2021 | $3,417 | $181,019 | $91,669 | $89,350 |
| 2020 | $3,653 | $179,164 | $90,730 | $88,434 |
| 2019 | $3,614 | $175,651 | $88,951 | $86,700 |
| 2018 | $3,497 | $172,207 | $87,207 | $85,000 |
| 2016 | $3,313 | $165,522 | $83,822 | $81,700 |
| 2015 | $3,180 | $163,036 | $82,563 | $80,473 |
| 2014 | $3,130 | $159,843 | $80,946 | $78,897 |
Source: Public Records
Map
Nearby Homes
- 803 N Grandee Ave
- 1019 W Arbutus St
- 836 W Cedar St
- 814 W Maple St
- 806 W Spruce St
- 316 N Maie Ave
- 910 W Palmer St
- 1317 W School St
- 922 W School St
- 720 W Cherry St
- 1206 W Magnolia St
- 485 W Compton Blvd
- 9607 S Evers Ave
- 1410 W School St
- 1201 W 138th St
- 969 W Dhalia St
- Plan 1 at Concord Court
- Plan 3 at Concord Court
- Plan 2 at Concord Court
- 144 S Iris
- 907 N Dwight Ave
- 910 N Grandee Ave
- 906 N Grandee Ave
- 903 N Dwight Ave
- 902 N Grandee Ave
- 1001 W Spruce St
- 910 N Dwight Ave
- 914 N Dwight Ave
- 1005 W Spruce St
- 821 N Dwight Ave
- 904 N Dwight Ave
- 1002 N Dwight Ave
- 1028 N Dwight Ave
- 818 N Grandee Ave
- 1009 W Spruce St
- 1006 N Dwight Ave
- 900 N Dwight Ave
- 1015 W Spruce St
- 815 N Dwight Ave
- 814 N Grandee Ave