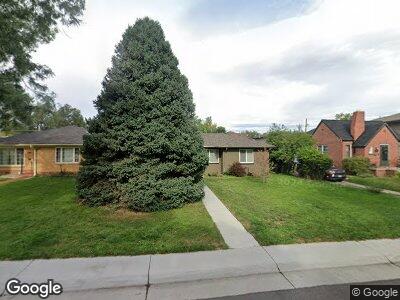
911 N Locust St Denver, CO 80220
Montclair NeighborhoodEstimated Value: $609,000 - $613,418
2
Beds
1
Bath
1,095
Sq Ft
$559/Sq Ft
Est. Value
About This Home
This home is located at 911 N Locust St, Denver, CO 80220 and is currently estimated at $611,605, approximately $558 per square foot. 911 N Locust St is a home located in Denver County with nearby schools including Palmer Elementary School, Hill Campus of Arts & Sciences, and George Washington High School.
Ownership History
Date
Name
Owned For
Owner Type
Purchase Details
Closed on
Oct 26, 2017
Sold by
Cannizzaro Ryan Neil and Cannizzaro Megan Rigdon
Bought by
Lepore Molly A
Current Estimated Value
Home Financials for this Owner
Home Financials are based on the most recent Mortgage that was taken out on this home.
Original Mortgage
$340,000
Interest Rate
3.78%
Mortgage Type
New Conventional
Purchase Details
Closed on
Sep 17, 2014
Sold by
Lyle Ninfa C
Bought by
Cannizzaro Ryan Neil and Cannizzaro Megan Rigdon
Purchase Details
Closed on
Jun 5, 2013
Sold by
Lyle Percy H
Bought by
Lyle Ninfa C
Purchase Details
Closed on
Nov 27, 2007
Sold by
Lyle Percy H
Bought by
Lyle Percy H and Lyle Ninfa C
Home Financials for this Owner
Home Financials are based on the most recent Mortgage that was taken out on this home.
Original Mortgage
$188,800
Interest Rate
6.26%
Mortgage Type
New Conventional
Create a Home Valuation Report for This Property
The Home Valuation Report is an in-depth analysis detailing your home's value as well as a comparison with similar homes in the area
Home Values in the Area
Average Home Value in this Area
Purchase History
| Date | Buyer | Sale Price | Title Company |
|---|---|---|---|
| Lepore Molly A | $425,000 | Land T Guarantee Co | |
| Cannizzaro Ryan Neil | $328,000 | Land Title Guarantee Company | |
| Lyle Ninfa C | -- | None Available | |
| Lyle Percy H | -- | Land Title Guarantee Company |
Source: Public Records
Mortgage History
| Date | Status | Borrower | Loan Amount |
|---|---|---|---|
| Open | Lepore Molly A | $30,000 | |
| Open | Lepore Molly A | $313,500 | |
| Closed | Lepore Molly A | $340,000 | |
| Previous Owner | Lyle Ninfa C | $186,283 | |
| Previous Owner | Lyle Percy H | $188,800 | |
| Previous Owner | Lyle Percy H | $40,000 | |
| Previous Owner | Lyle Percy H | $90,000 | |
| Previous Owner | Lyle Percy H | $75,000 |
Source: Public Records
Tax History Compared to Growth
Tax History
| Year | Tax Paid | Tax Assessment Tax Assessment Total Assessment is a certain percentage of the fair market value that is determined by local assessors to be the total taxable value of land and additions on the property. | Land | Improvement |
|---|---|---|---|---|
| 2024 | $3,000 | $37,880 | $27,700 | $10,180 |
| 2023 | $2,935 | $37,880 | $27,700 | $10,180 |
| 2022 | $2,710 | $34,080 | $26,050 | $8,030 |
| 2021 | $2,617 | $35,070 | $26,800 | $8,270 |
| 2020 | $2,420 | $32,620 | $26,800 | $5,820 |
| 2019 | $2,352 | $32,620 | $26,800 | $5,820 |
| 2018 | $2,075 | $26,820 | $17,990 | $8,830 |
| 2017 | $2,069 | $26,820 | $17,990 | $8,830 |
| 2016 | $1,839 | $22,550 | $18,642 | $3,908 |
| 2015 | $1,762 | $22,550 | $18,642 | $3,908 |
| 2014 | $1,438 | $17,320 | $14,917 | $2,403 |
Source: Public Records
Map
Nearby Homes
- 1030 Krameria St
- 860 Magnolia St
- 770 Locust St
- 915 Kearney St
- 945 Niagara St
- 841 Niagara St
- 835 Niagara St
- 950 Jasmine St
- 810 Jasmine St
- 1010 Jasmine St
- 718 Locust St
- 760 Niagara St
- 1157 Krameria St Unit 101
- 785 Jasmine St
- 1166 Krameria St
- 1165 Krameria St Unit 111
- 650 Kearney St
- 640 Magnolia St
- 6435 E 6th Avenue Pkwy
- 6235 E 6th Avenue Pkwy