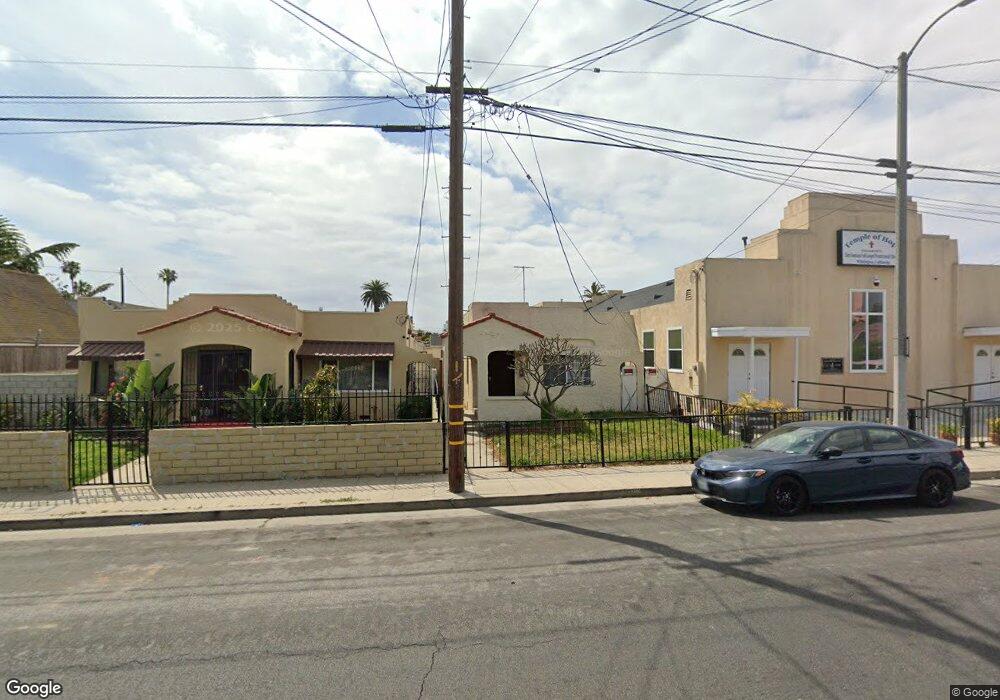
911 N Neptune Ave Wilmington, CA 90744
Estimated Value: $616,000 - $685,000
3
Beds
1
Bath
1,124
Sq Ft
$576/Sq Ft
Est. Value
About This Home
This home is located at 911 N Neptune Ave, Wilmington, CA 90744 and is currently estimated at $647,837, approximately $576 per square foot. 911 N Neptune Ave is a home located in Los Angeles County with nearby schools including George De La Torre Jr. Elementary, Phineas Banning Senior High School, and Sts. Peter And St. Paul School.
Ownership History
Date
Name
Owned For
Owner Type
Purchase Details
Closed on
Aug 1, 2025
Sold by
Lawlor Jeannine and Lawlow Jeannine
Bought by
Lawlor Jeannine
Current Estimated Value
Purchase Details
Closed on
Mar 28, 2025
Sold by
Katherine D Brizendine Revocable Trust and Lawlor Jeannine
Bought by
Katherine D Brizendine Revocable Trust and Lawlor
Purchase Details
Closed on
Apr 3, 2017
Sold by
Tegel
Bought by
Tegel
Home Financials for this Owner
Home Financials are based on the most recent Mortgage that was taken out on this home.
Interest Rate
4.14%
Purchase Details
Closed on
Jan 6, 2005
Sold by
Tilo Fagalele
Bought by
First Samoan Full Gospel Pentecostal Chu
Purchase Details
Closed on
Oct 26, 2001
Sold by
Tilo Mary
Bought by
Tilo Fagalele
Home Financials for this Owner
Home Financials are based on the most recent Mortgage that was taken out on this home.
Original Mortgage
$125,000
Interest Rate
7%
Create a Home Valuation Report for This Property
The Home Valuation Report is an in-depth analysis detailing your home's value as well as a comparison with similar homes in the area
Home Values in the Area
Average Home Value in this Area
Purchase History
| Date | Buyer | Sale Price | Title Company |
|---|---|---|---|
| Lawlor Jeannine | -- | None Listed On Document | |
| Katherine D Brizendine Revocable Trust | -- | None Listed On Document | |
| Tegel | -- | -- | |
| First Samoan Full Gospel Pentecostal Chu | -- | -- | |
| Tilo Fagalele | -- | Lawyers Title Company |
Source: Public Records
Mortgage History
| Date | Status | Borrower | Loan Amount |
|---|---|---|---|
| Previous Owner | Tegel | -- | |
| Previous Owner | Tilo Fagalele | $125,000 |
Source: Public Records
Tax History Compared to Growth
Tax History
| Year | Tax Paid | Tax Assessment Tax Assessment Total Assessment is a certain percentage of the fair market value that is determined by local assessors to be the total taxable value of land and additions on the property. | Land | Improvement |
|---|---|---|---|---|
| 2025 | $4,686 | $376,341 | $243,927 | $132,414 |
| 2024 | $4,686 | $368,963 | $239,145 | $129,818 |
| 2023 | $4,598 | $361,729 | $234,456 | $127,273 |
| 2022 | $4,387 | $354,637 | $229,859 | $124,778 |
| 2021 | $4,331 | $347,684 | $225,352 | $122,332 |
| 2019 | $4,204 | $337,373 | $218,669 | $118,704 |
| 2018 | $4,157 | $330,759 | $214,382 | $116,377 |
| 2016 | $3,969 | $317,917 | $206,058 | $111,859 |
| 2015 | $3,768 | $301,000 | $195,000 | $106,000 |
| 2014 | $3,371 | $261,000 | $169,000 | $92,000 |
Source: Public Records
Map
Nearby Homes
- 915 N Neptune Ave
- 905 N Neptune Ave
- 919 N Neptune Ave
- 901 N Neptune Ave
- 617 W I St
- 921 N Neptune Ave
- 925 N Neptune Ave
- 908 Bay View Ave
- 912 Bay View Ave
- 914 Bay View Ave
- 904 Bay View Ave
- 912 N Neptune Ave Unit 3
- 912 N Neptune Ave
- 918 Bay View Ave
- 902 Bay View Ave
- 920 Bay View Ave
- 608 W I St
- 922 Bay View Ave
- 614 W I St
- 931 N Neptune Ave