
Seller's Agent in 2026
Jacob Fish
EDGE Realty ERA Powered
(573) 450-3791
7 in this area
594 Total Sales


Estimated Value: $212,000 - $237,000
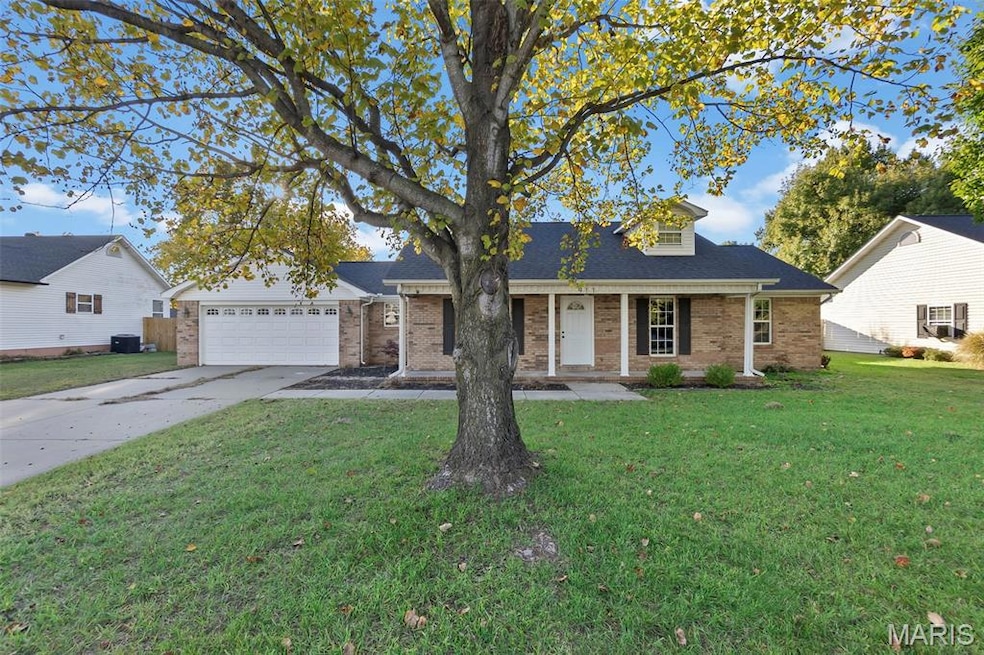
This home is located at 911 Pine St, Sikeston, MO 63801 since 07 November 2025 and is currently estimated at $220,271, approximately $153 per square foot. This property was built in 1997. 911 Pine St is a home with nearby schools including Sikeston Senior High School, Southeast Missouri Christian Academy, and The Christian Academy.
Last Agent to Sell the Property
EDGE Realty ERA Powered License #2010013545 Listed on: 11/07/2025
We collect this data history from publicly available records. To have your information removed, we recommend requesting removal directly through your county’s website.
| Date | Buyer | Sale Price | Title Company |
|---|---|---|---|
| Bowden Latricia | -- | None Listed On Document | |
| Synergy Enterprises Llc | -- | Reliable Community Title | |
| Mcgee Gregory L | -- | Semo Title | |
| Johnston David L | -- | -- |
We collect this data history from publicly available records. To have your information removed, we recommend requesting removal directly through your county’s website.
| Date | Status | Borrower | Loan Amount |
|---|---|---|---|
| Open | Bowden Latricia | $216,464 | |
| Previous Owner | Synergy Enterprises Llc | $172,000 | |
| Previous Owner | Mcgee Gregory L | $128,250 | |
| Previous Owner | Johnston David L | $109,999 |
| Date | Event | Price | List to Sale | Price per Sq Ft |
|---|---|---|---|---|
| 02/12/2026 02/12/26 | Sold | -- | -- | -- |
| 01/07/2026 01/07/26 | Pending | -- | -- | -- |
| 12/29/2025 12/29/25 | Price Changed | $220,000 | -12.0% | $154 / Sq Ft |
| 11/07/2025 11/07/25 | For Sale | $250,000 | -- | $175 / Sq Ft |
| Year | Tax Paid | Tax Assessment Tax Assessment Total Assessment is a certain percentage of the fair market value that is determined by local assessors to be the total taxable value of land and additions on the property. | Land | Improvement |
|---|---|---|---|---|
| 2025 | $1,739 | $31,300 | $3,000 | $28,300 |
| 2024 | $1,161 | $23,400 | $3,000 | $20,400 |
| 2023 | $1,166 | $23,400 | $0 | $0 |
| 2022 | $1,058 | $21,400 | $3,000 | $18,400 |
| 2021 | $1,057 | $21,400 | $0 | $0 |
| 2020 | $928 | $21,400 | $0 | $0 |
| 2019 | $864 | $19,000 | $3,000 | $16,000 |
| 2017 | $809 | $17,970 | $0 | $0 |
| 2016 | -- | $17,970 | $0 | $0 |
| 2015 | -- | $17,970 | $0 | $0 |
| 2014 | -- | $17,970 | $0 | $0 |
| 2011 | -- | $0 | $0 | $0 |
Seller's Agent in 2026
Jacob Fish
EDGE Realty ERA Powered
(573) 450-3791
7 in this area
594 Total Sales
Buyer's Agent in 2026
Lawren McMullan
EDGE Realty, ERA Powered
(573) 380-3664
48 in this area
67 Total Sales
Source: MARIS MLS
MLS Number: MIS25075178
APN: 01-9.1-029-03-003-0004.00
Disclaimer: Certain information contained herein is derived from information provided by parties other than Homes.com. All information provided is deemed reliable, but is not guaranteed to be accurate and should be independently verified.
![]() All data is obtained from various sources and may not have been verified by broker or MLS GRID. Supplied Open House Information is subject to change without notice. All information should be independently reviewed and verified for accuracy. Properties may or may not be listed by the office/agent presenting the information. Some IDX listings have been excluded from this website.
All data is obtained from various sources and may not have been verified by broker or MLS GRID. Supplied Open House Information is subject to change without notice. All information should be independently reviewed and verified for accuracy. Properties may or may not be listed by the office/agent presenting the information. Some IDX listings have been excluded from this website.
Listings courtesy of MARIS MLS as distributed by MLS GRID.
Based on information submitted to the MLS GRID
Ask me questions while you tour the home.