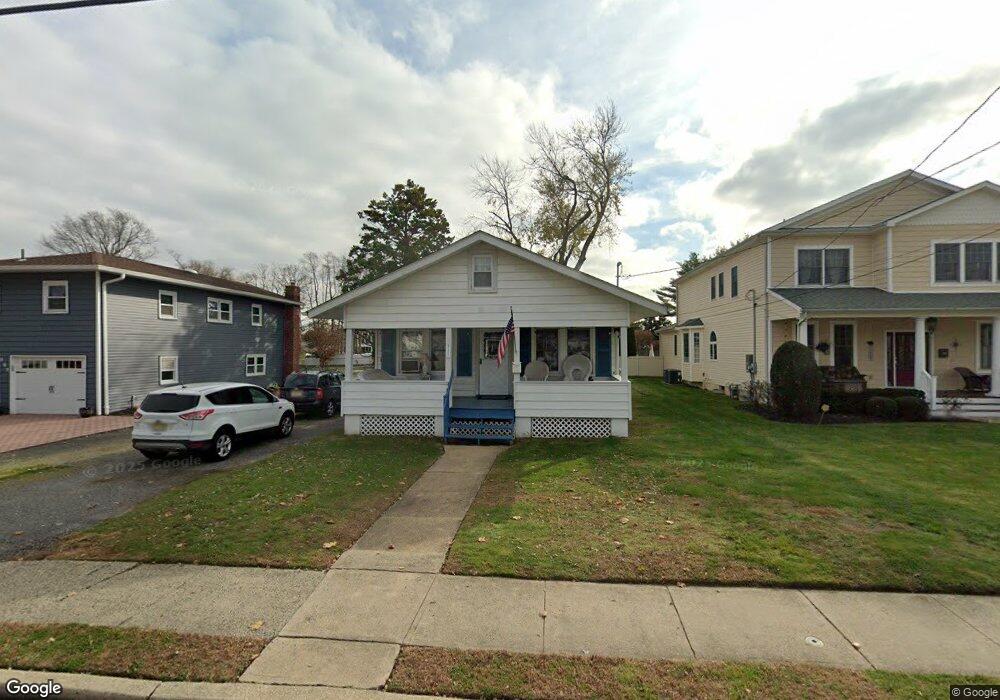
911 Wall Rd Spring Lake, NJ 07762
Estimated Value: $685,000 - $926,000
2
Beds
1
Bath
923
Sq Ft
$890/Sq Ft
Est. Value
About This Home
This home is located at 911 Wall Rd, Spring Lake, NJ 07762 and is currently estimated at $821,571, approximately $890 per square foot. 911 Wall Rd is a home located in Monmouth County with nearby schools including Spring Lake Heights Elementary School and The Brookside School.
Ownership History
Date
Name
Owned For
Owner Type
Purchase Details
Closed on
Oct 13, 2005
Sold by
Ostrom Robert A
Bought by
Lake Heights Boro Spring
Current Estimated Value
Purchase Details
Closed on
Oct 7, 2005
Sold by
Crimson Properties Llc
Bought by
Ostrom Robert A and Sullivan Jean
Purchase Details
Closed on
Jun 29, 1995
Sold by
Feehan Elaine
Bought by
Ostrom Robert and Romano Marilynn
Home Financials for this Owner
Home Financials are based on the most recent Mortgage that was taken out on this home.
Original Mortgage
$126,000
Interest Rate
7.84%
Create a Home Valuation Report for This Property
The Home Valuation Report is an in-depth analysis detailing your home's value as well as a comparison with similar homes in the area
Home Values in the Area
Average Home Value in this Area
Purchase History
| Date | Buyer | Sale Price | Title Company |
|---|---|---|---|
| Lake Heights Boro Spring | -- | -- | |
| Ostrom Robert A | -- | -- | |
| Ostrom Robert | $140,000 | -- |
Source: Public Records
Mortgage History
| Date | Status | Borrower | Loan Amount |
|---|---|---|---|
| Previous Owner | Ostrom Robert | $126,000 |
Source: Public Records
Tax History
| Year | Tax Paid | Tax Assessment Tax Assessment Total Assessment is a certain percentage of the fair market value that is determined by local assessors to be the total taxable value of land and additions on the property. | Land | Improvement |
|---|---|---|---|---|
| 2025 | $7,372 | $784,400 | $674,900 | $109,500 |
| 2024 | $6,549 | $700,100 | $592,600 | $107,500 |
| 2023 | $6,549 | $584,700 | $479,700 | $105,000 |
| 2022 | $5,797 | $489,100 | $402,600 | $86,500 |
| 2021 | $5,797 | $429,400 | $350,700 | $78,700 |
| 2020 | $5,732 | $422,100 | $350,700 | $71,400 |
| 2019 | $5,764 | $420,100 | $350,700 | $69,400 |
| 2018 | $5,849 | $414,800 | $350,700 | $64,100 |
| 2017 | $5,630 | $414,000 | $350,700 | $63,300 |
| 2016 | $5,690 | $413,200 | $350,700 | $62,500 |
| 2015 | $5,651 | $411,600 | $350,700 | $60,900 |
| 2014 | $5,522 | $411,200 | $350,700 | $60,500 |
Source: Public Records
Map
Nearby Homes
- 809 Wall Rd
- 2419 Kipling Ave
- 815 Woodcrest Dr
- 23 Locust Way
- 1838 State Route 35 Unit 10
- 16 Cherry Ct
- 420 Ludlow Ave
- 27 Apple Dr
- 1731 Grove St
- 1726 M St
- 1813 World St
- 1210 Xanadu Ln Unit A1210
- 2005 Nassau Dr
- 217 Pitney Ave
- 513 Mercer Ave
- 2208 2nd Ave
- 207 Tuttle Ave
- 604 Monmouth Ave
- 1805 Margerum Ave
- 206 Brighton Ave
Your Personal Tour Guide
Ask me questions while you tour the home.