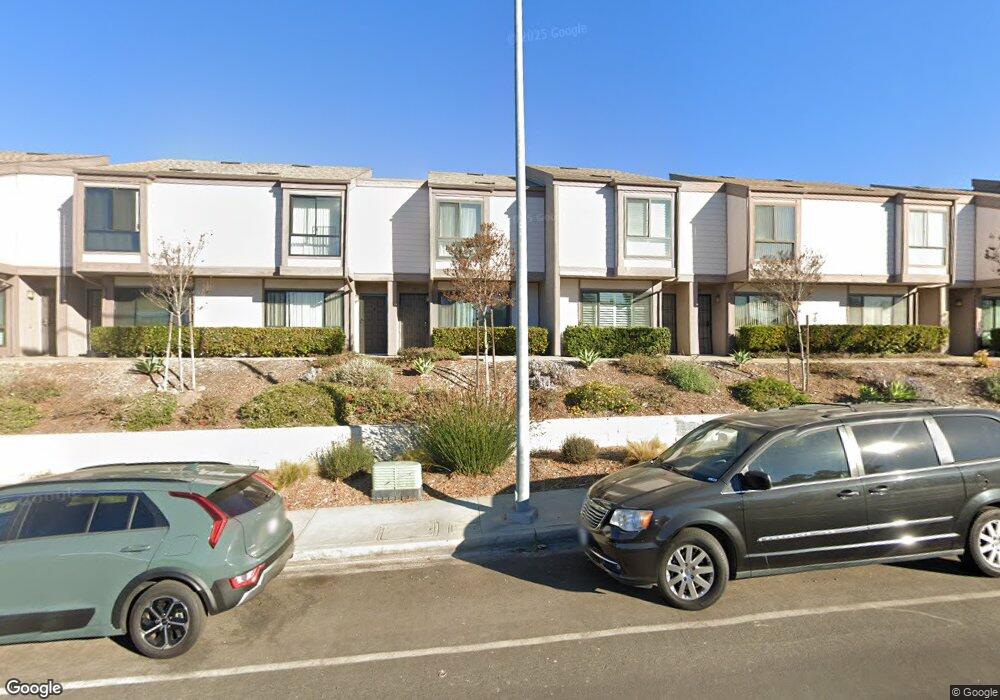
9110 Gramercy Dr Unit 332 San Diego, CA 92123
Serra Mesa NeighborhoodEstimated Value: $556,000 - $654,000
2
Beds
2
Baths
1,011
Sq Ft
$578/Sq Ft
Est. Value
About This Home
This home is located at 9110 Gramercy Dr Unit 332, San Diego, CA 92123 and is currently estimated at $584,665, approximately $578 per square foot. 9110 Gramercy Dr Unit 332 is a home located in San Diego County with nearby schools including Wegeforth Elementary School, Taft Middle School, and St. Columba Catholic School.
Ownership History
Date
Name
Owned For
Owner Type
Purchase Details
Closed on
Aug 13, 2019
Sold by
Situ Dong and Jiang Yumei
Bought by
Situ Dong and Jiang Yumei
Current Estimated Value
Home Financials for this Owner
Home Financials are based on the most recent Mortgage that was taken out on this home.
Original Mortgage
$236,250
Outstanding Balance
$206,483
Interest Rate
3.6%
Mortgage Type
New Conventional
Estimated Equity
$378,182
Purchase Details
Closed on
Jun 6, 2011
Sold by
Odonnell Anne M
Bought by
Situ Dong and Jiang Yumei
Home Financials for this Owner
Home Financials are based on the most recent Mortgage that was taken out on this home.
Original Mortgage
$120,000
Interest Rate
2.87%
Mortgage Type
New Conventional
Purchase Details
Closed on
Feb 11, 2008
Sold by
Odonnell Anne
Bought by
Odonnell Anne M
Home Financials for this Owner
Home Financials are based on the most recent Mortgage that was taken out on this home.
Original Mortgage
$150,000
Interest Rate
5.25%
Mortgage Type
Stand Alone Refi Refinance Of Original Loan
Purchase Details
Closed on
Dec 7, 2004
Sold by
Odonnell Anne M
Bought by
Odonnell Anne M
Home Financials for this Owner
Home Financials are based on the most recent Mortgage that was taken out on this home.
Original Mortgage
$120,000
Interest Rate
5.12%
Mortgage Type
Purchase Money Mortgage
Purchase Details
Closed on
Oct 14, 2004
Sold by
Odonnell Anne M
Bought by
Odonnell Ane M
Home Financials for this Owner
Home Financials are based on the most recent Mortgage that was taken out on this home.
Original Mortgage
$120,000
Interest Rate
5.12%
Mortgage Type
Purchase Money Mortgage
Purchase Details
Closed on
Mar 1, 2002
Sold by
Odonnell Anne M
Bought by
Odonnell Anne M
Purchase Details
Closed on
Dec 5, 2001
Sold by
Clark Linda A
Bought by
Odonnell Anne M
Home Financials for this Owner
Home Financials are based on the most recent Mortgage that was taken out on this home.
Original Mortgage
$90,000
Interest Rate
6.51%
Mortgage Type
Purchase Money Mortgage
Purchase Details
Closed on
Jan 9, 1998
Sold by
Security Pacific Financial Svcs Of Ca In
Bought by
Clark Linda A
Home Financials for this Owner
Home Financials are based on the most recent Mortgage that was taken out on this home.
Original Mortgage
$86,266
Interest Rate
7.05%
Mortgage Type
FHA
Purchase Details
Closed on
Oct 2, 1997
Sold by
Burks Wilson Patricia A
Bought by
Security Pacific Financial Svcs Of Ca
Purchase Details
Closed on
Mar 6, 1992
Purchase Details
Closed on
Jun 17, 1987
Create a Home Valuation Report for This Property
The Home Valuation Report is an in-depth analysis detailing your home's value as well as a comparison with similar homes in the area
Home Values in the Area
Average Home Value in this Area
Purchase History
| Date | Buyer | Sale Price | Title Company |
|---|---|---|---|
| Situ Dong | -- | First American Title Company | |
| Situ Dong | $182,000 | Chicago Title Company | |
| Odonnell Anne M | -- | Commonwealth Land Title Co | |
| Odonnell Anne | -- | Commonwealth Land Title Co | |
| Odonnell Anne M | -- | -- | |
| Odonnell Ane M | -- | Ticor Title Company | |
| Odonnell Anne M | -- | Ticor Title Company | |
| Odonnell Anne M | -- | -- | |
| Odonnell Anne M | $169,000 | Commonwealth Land Title Co | |
| Clark Linda A | $88,500 | Fidelity National Title Co | |
| Security Pacific Financial Svcs Of Ca | $38,500 | American Title | |
| -- | $104,000 | -- | |
| -- | $76,500 | -- |
Source: Public Records
Mortgage History
| Date | Status | Borrower | Loan Amount |
|---|---|---|---|
| Open | Situ Dong | $236,250 | |
| Previous Owner | Situ Dong | $120,000 | |
| Previous Owner | Odonnell Anne | $150,000 | |
| Previous Owner | Odonnell Anne M | $120,000 | |
| Previous Owner | Odonnell Anne M | $90,000 | |
| Previous Owner | Clark Linda A | $86,266 |
Source: Public Records
Tax History Compared to Growth
Tax History
| Year | Tax Paid | Tax Assessment Tax Assessment Total Assessment is a certain percentage of the fair market value that is determined by local assessors to be the total taxable value of land and additions on the property. | Land | Improvement |
|---|---|---|---|---|
| 2025 | $2,839 | $233,158 | $95,324 | $137,834 |
| 2024 | $2,839 | $228,587 | $93,455 | $135,132 |
| 2023 | $2,776 | $224,106 | $91,623 | $132,483 |
| 2022 | $2,703 | $219,713 | $89,827 | $129,886 |
| 2021 | $2,685 | $215,406 | $88,066 | $127,340 |
| 2020 | $2,652 | $213,198 | $87,163 | $126,035 |
| 2019 | $2,605 | $209,018 | $85,454 | $123,564 |
| 2018 | $2,437 | $204,921 | $83,779 | $121,142 |
| 2017 | $80 | $200,904 | $82,137 | $118,767 |
| 2016 | $2,341 | $196,966 | $80,527 | $116,439 |
| 2015 | $2,307 | $194,008 | $79,318 | $114,690 |
| 2014 | $2,271 | $190,209 | $77,765 | $112,444 |
Source: Public Records
Map
Nearby Homes
- 9120 Gramercy Dr Unit 319
- 9189 Village Glen Dr Unit 148
- 9229 Village Glen Dr Unit 235
- 3454 Castle Glen Dr Unit 107
- 3454 Castle Glen Dr Unit 115
- 8975 Gramercy Dr
- 8955 Gramercy Dr
- 3169 Mission Village Dr
- 3541 Pomeroy St
- 3425 Angwin Dr
- 9192 Fermi Ave
- 3571 Ruffin Rd Unit 239
- 3567 Ruffin Rd Unit 134
- 3161 Skipper St
- 3216 Towser St
- 3575 Ruffin Rd Unit 204
- 3488 Ediwhar Ave
- 9006 Haveteur Way
- 8805 Laddie Ln
- 3356 Lockwood Dr
- 9130 Gramercy Dr Unit 198
- 9130 Gramercy Dr
- 9150 Gramercy Dr
- 9130 Gramercy Dr Unit 312
- 9150 Gramercy Dr Unit 191
- 9110 Gramercy Dr Unit 334
- 9110 Gramercy Dr Unit 333
- 9110 Gramercy Dr Unit 331
- 9110 Gramercy Dr Unit 330
- 9110 Gramercy Dr Unit 329
- 9110 Gramercy Dr Unit 328
- 9110 Gramercy Dr Unit 327
- 9110 Gramercy Dr Unit 326
- 9110 Gramercy Dr Unit 325
- 9110 Gramercy Dr Unit 324
- 9110 Gramercy Dr Unit 323
- 9150 Gramercy Dr Unit 294
- 9150 Gramercy Dr Unit 293
- 9150 Gramercy Dr Unit 292
- 9150 Gramercy Dr Unit 291