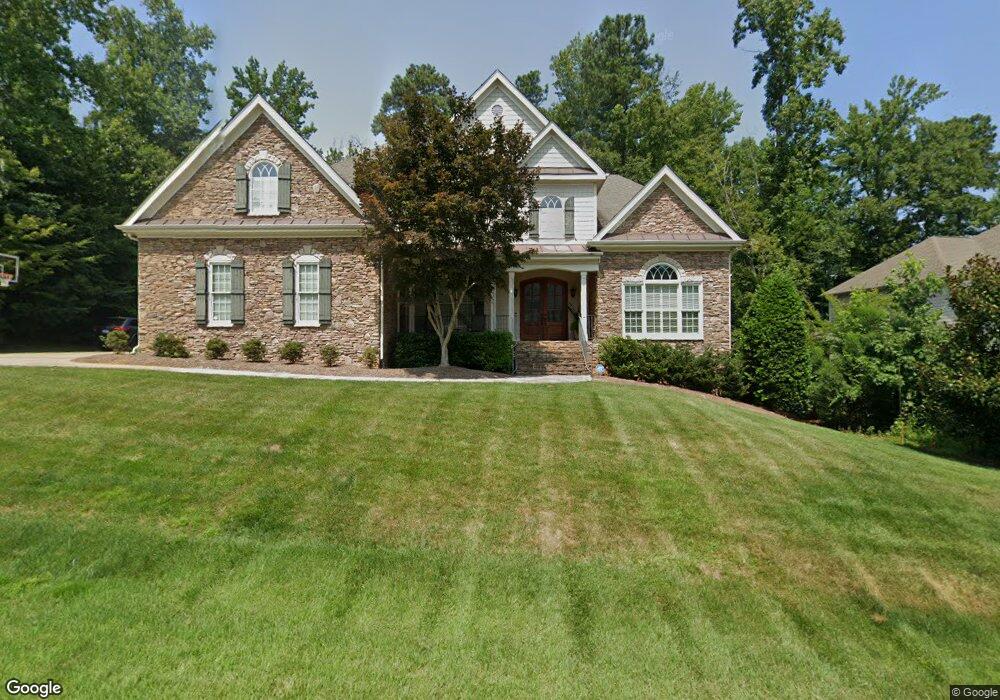
9111 Concord Hill Ct Unit Lt 40 Raleigh, NC 27613
Northwest Raleigh NeighborhoodEstimated Value: $1,265,562 - $1,390,000
4
Beds
4
Baths
4,544
Sq Ft
$296/Sq Ft
Est. Value
About This Home
This home is located at 9111 Concord Hill Ct Unit Lt 40, Raleigh, NC 27613 and is currently estimated at $1,343,391, approximately $295 per square foot. 9111 Concord Hill Ct Unit Lt 40 is a home located in Wake County with nearby schools including Leesville Road Middle School, Leesville Road High School, and Quest Academy.
Ownership History
Date
Name
Owned For
Owner Type
Purchase Details
Closed on
Dec 14, 2017
Sold by
Fedock Michael John and Fedock Andrea Kaplan
Bought by
Fedock Michael J and Fedock Andrea K
Current Estimated Value
Purchase Details
Closed on
Jun 14, 2016
Sold by
Grossi Peter M and Trinh Jane V
Bought by
Fedock Michael John and Fedock Andrea Kaplan
Home Financials for this Owner
Home Financials are based on the most recent Mortgage that was taken out on this home.
Original Mortgage
$400,000
Outstanding Balance
$318,356
Interest Rate
3.57%
Mortgage Type
New Conventional
Estimated Equity
$1,025,035
Purchase Details
Closed on
May 9, 2008
Sold by
Jerry Wagoner Construction Inc
Bought by
Grossi Peter M and Trinh Jane
Home Financials for this Owner
Home Financials are based on the most recent Mortgage that was taken out on this home.
Original Mortgage
$830,000
Interest Rate
6.87%
Mortgage Type
Purchase Money Mortgage
Create a Home Valuation Report for This Property
The Home Valuation Report is an in-depth analysis detailing your home's value as well as a comparison with similar homes in the area
Home Values in the Area
Average Home Value in this Area
Purchase History
| Date | Buyer | Sale Price | Title Company |
|---|---|---|---|
| Fedock Michael J | -- | None Available | |
| Fedock Michael John | $707,500 | None Available | |
| Grossi Peter M | $830,000 | None Available |
Source: Public Records
Mortgage History
| Date | Status | Borrower | Loan Amount |
|---|---|---|---|
| Open | Fedock Michael John | $400,000 | |
| Previous Owner | Grossi Peter M | $830,000 |
Source: Public Records
Tax History Compared to Growth
Tax History
| Year | Tax Paid | Tax Assessment Tax Assessment Total Assessment is a certain percentage of the fair market value that is determined by local assessors to be the total taxable value of land and additions on the property. | Land | Improvement |
|---|---|---|---|---|
| 2025 | $9,762 | $1,117,082 | $225,000 | $892,082 |
| 2024 | $9,722 | $1,117,082 | $225,000 | $892,082 |
| 2023 | $9,631 | $881,707 | $180,000 | $701,707 |
| 2022 | $8,947 | $881,707 | $180,000 | $701,707 |
| 2021 | $8,599 | $881,707 | $180,000 | $701,707 |
| 2020 | $8,442 | $881,707 | $180,000 | $701,707 |
| 2019 | $8,285 | $713,205 | $140,000 | $573,205 |
| 2018 | $7,812 | $713,205 | $140,000 | $573,205 |
| 2017 | $7,439 | $713,205 | $140,000 | $573,205 |
| 2016 | $7,286 | $713,205 | $140,000 | $573,205 |
| 2015 | -- | $817,863 | $152,000 | $665,863 |
| 2014 | -- | $817,863 | $152,000 | $665,863 |
Source: Public Records
Map
Nearby Homes
- 5020 Celbridge Place
- 10109 Goodview Ct
- 8802 Fidelis Ln
- 8801 Wildwood Links
- 3812 Covina Dr
- 12909 Baybriar Dr
- 8326 Ray Rd
- 8701 Oneal Rd
- 9305 Field Maple Ct
- 9309 Field Maple Ct
- 8604 Wellsley Way
- 8701 Gleneagles Dr
- 8605 Brookdale Dr
- 5009 Wood Valley Dr
- 2704 Smokey Ridge Rd
- 8404 Sleepy Creek Dr
- 3008 Eden Harbor Ct
- 13217 Ashford Park Dr
- 13204 Ashford Park Dr
- 2300 Valley Forge Dr
- 9111 Concord Hill Ct
- 9115 Concord Hill Ct
- 9101 Concord Hill Ct
- 3910 Ashtonshire Ct
- 3910 Ashtonshire Ct Unit 38
- 9104 Aspenshire Ct
- 9106 Concord Hill Ct
- 9110 Concord Hill Ct
- 3909 Bending Birch Dr
- 3905 Bending Birch Dr
- 3905 Bending Birch Dr Unit Lt 42
- 9116 Concord Hill Ct
- 9102 Concord Hill Ct
- 3921 Bending Birch Dr
- 3921 Bending Birch Dr Unit Lt 44
- 9105 Aspenshire Ct
- 9105 Aspenshire Ct Unit Lt 46
- 9031 Concord Hill Ct
- 3912 Ashtonshire Ct
- 9120 Concord Hill Ct