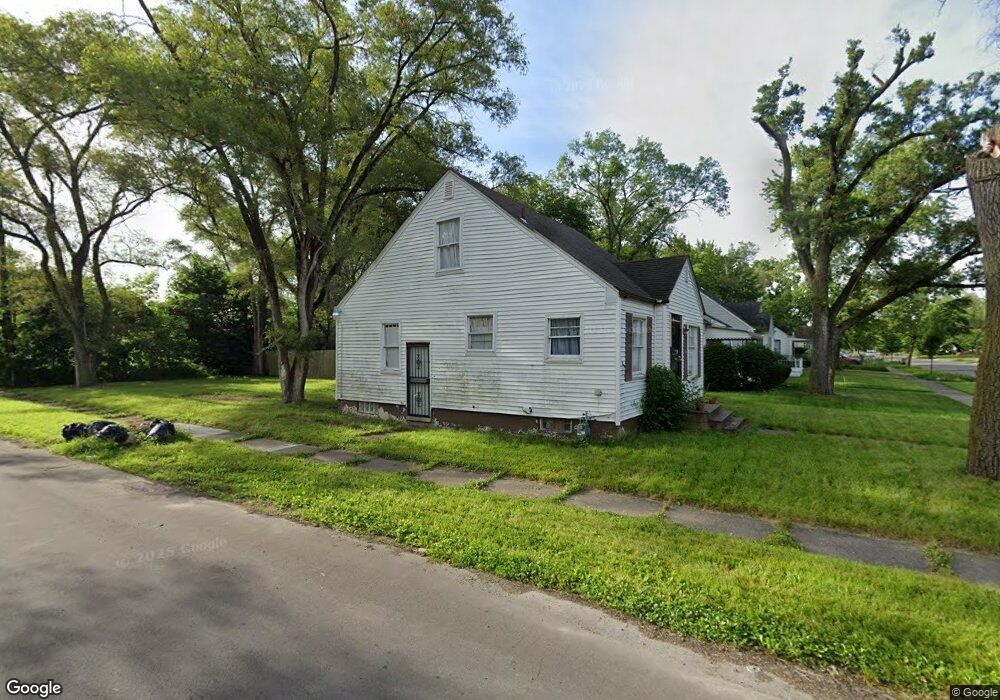
9112 Minock St Detroit, MI 48228
Franklin Park NeighborhoodEstimated Value: $71,000 - $82,642
3
Beds
1
Bath
1,100
Sq Ft
$69/Sq Ft
Est. Value
About This Home
This home is located at 9112 Minock St, Detroit, MI 48228 and is currently estimated at $75,411, approximately $68 per square foot. 9112 Minock St is a home located in Wayne County with nearby schools including Bates Academy, Charles L. Spain Elementary-Middle School, and Edward 'Duke' Ellington Conservatory of Music and Art.
Ownership History
Date
Name
Owned For
Owner Type
Purchase Details
Closed on
Dec 7, 2016
Sold by
Sabree Eric R
Bought by
Mines Regina
Current Estimated Value
Purchase Details
Closed on
Nov 16, 2012
Sold by
Wayne County Treasurer
Bought by
Ephrain Construction Co
Purchase Details
Closed on
Jul 23, 2009
Sold by
Aurora Loan Services Llc
Bought by
Vanguard Property Group Llc
Purchase Details
Closed on
Jul 24, 2008
Sold by
Rogers Ginger L
Bought by
Aurora Loan Services Llc
Purchase Details
Closed on
Mar 26, 2007
Sold by
Hwb Holdings Inc
Bought by
Rogers Ginger L
Purchase Details
Closed on
Oct 17, 2006
Sold by
Mortgage Electronic Registration Systems
Bought by
Matrix Financial Services
Purchase Details
Closed on
Oct 19, 2005
Sold by
Foster Jumond C
Bought by
Mortgage Electronic Registration Systems
Purchase Details
Closed on
Dec 17, 2002
Sold by
Mortgage Ltd
Bought by
Foster Jumond C
Create a Home Valuation Report for This Property
The Home Valuation Report is an in-depth analysis detailing your home's value as well as a comparison with similar homes in the area
Home Values in the Area
Average Home Value in this Area
Purchase History
| Date | Buyer | Sale Price | Title Company |
|---|---|---|---|
| Mines Regina | $1,200 | None Available | |
| Ephrain Construction Co | $1,120 | None Available | |
| Vanguard Property Group Llc | -- | E Title Agency Inc | |
| Aurora Loan Services Llc | $69,000 | None Available | |
| Rogers Ginger L | $92,000 | Clearly Title | |
| Matrix Financial Services | -- | First American Title | |
| Mortgage Electronic Registration Systems | $81,907 | None Available | |
| Foster Jumond C | $79,900 | -- | |
| Mortgage Ltd | -- | -- |
Source: Public Records
Tax History Compared to Growth
Tax History
| Year | Tax Paid | Tax Assessment Tax Assessment Total Assessment is a certain percentage of the fair market value that is determined by local assessors to be the total taxable value of land and additions on the property. | Land | Improvement |
|---|---|---|---|---|
| 2025 | $417 | $25,600 | $0 | $0 |
| 2024 | $417 | $21,200 | $0 | $0 |
| 2023 | $402 | $12,100 | $0 | $0 |
| 2022 | $466 | $10,700 | $0 | $0 |
| 2021 | $459 | $9,000 | $0 | $0 |
| 2020 | $459 | $7,700 | $0 | $0 |
| 2019 | $454 | $6,900 | $0 | $0 |
| 2018 | $422 | $6,000 | $0 | $0 |
| 2017 | $44 | $5,700 | $0 | $0 |
| 2016 | $445 | $2,700 | $0 | $0 |
| 2015 | $270 | $2,700 | $0 | $0 |
| 2013 | $1,522 | $15,220 | $0 | $0 |
| 2010 | -- | $21,807 | $914 | $20,893 |
Source: Public Records
Map
Nearby Homes
- 9221 Grandville Ave
- 9256 Auburn St
- 9042 Piedmont St
- 8889 Plainview Ave
- 8878 Evergreen Ave
- 19611 W Chicago St
- 8882 Warwick St
- 9528 Westwood St
- 9536 Minock St
- 9277 Vaughan St
- 9244 Heyden St
- 8832 Vaughan St
- 9319 Vaughan St
- 8656 Plainview Ave
- 9553 Auburn St
- 9570 Westwood St
- 9577 Minock St
- 9560 Plainview Ave
- 8610 Auburn St
- 9592 Minock St
- 9104 Minock St
- 9115 Westwood St
- 9094 Minock St
- 9200 Minock St
- 9206 Minock St
- 9086 Minock St
- 9105 Westwood St
- 9201 Westwood St
- 9212 Minock St
- 9078 Minock St
- 9091 Westwood St
- 9207 Westwood St
- 9113 Minock St
- 9105 Minock St
- 9216 Minock St
- 9085 Westwood St
- 9070 Minock St
- 9201 Minock St
- 9213 Westwood St
- 9091 Minock St