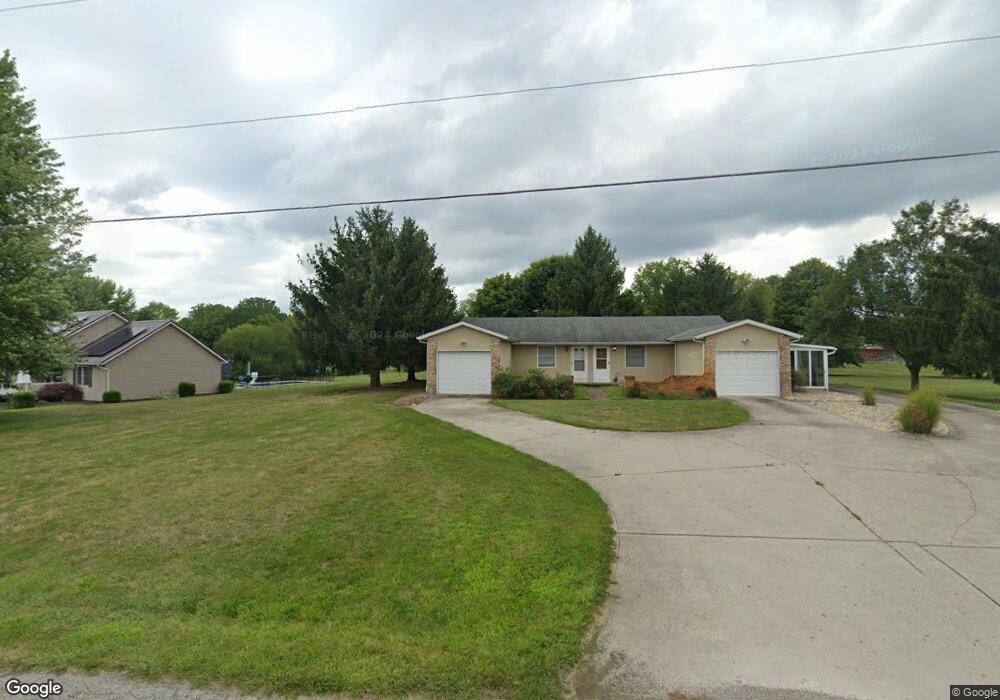
9115 Mccord Rd Orient, OH 43146
Estimated Value: $310,000 - $351,000
4
Beds
2
Baths
1,680
Sq Ft
$197/Sq Ft
Est. Value
About This Home
This home is located at 9115 Mccord Rd, Orient, OH 43146 and is currently estimated at $330,744, approximately $196 per square foot. 9115 Mccord Rd is a home located in Pickaway County.
Ownership History
Date
Name
Owned For
Owner Type
Purchase Details
Closed on
May 4, 2018
Sold by
Kauffeld Jenniffer and Kauffeld Michael
Bought by
Kauffeld Jenniffer P and Kauffeld Michael K
Current Estimated Value
Home Financials for this Owner
Home Financials are based on the most recent Mortgage that was taken out on this home.
Original Mortgage
$56,000
Outstanding Balance
$14,824
Interest Rate
4.4%
Mortgage Type
Commercial
Estimated Equity
$315,920
Purchase Details
Closed on
Jan 3, 2017
Sold by
Moon Gary L and Moon Dianna L
Bought by
Kauffeld Jennifer and Kauffeld Michael
Purchase Details
Closed on
Dec 15, 2016
Sold by
Waugh Kacie D
Bought by
Puls Donna J and Moon Gary L
Purchase Details
Closed on
Dec 14, 2016
Sold by
Moon Gary L and Moon Dianna L
Bought by
Waugh Kacie D
Purchase Details
Closed on
Dec 3, 2016
Sold by
Moon Gary L and Moon Dianna L
Bought by
Neal Jerry D and Neal Mary J
Create a Home Valuation Report for This Property
The Home Valuation Report is an in-depth analysis detailing your home's value as well as a comparison with similar homes in the area
Home Values in the Area
Average Home Value in this Area
Purchase History
| Date | Buyer | Sale Price | Title Company |
|---|---|---|---|
| Kauffeld Jenniffer P | -- | Valmer Land Title Agency | |
| Kauffeld Jennifer | $170,000 | Valmer Land Title Agency | |
| Puls Donna J | -- | Valmer Land Title Agency Box | |
| Waugh Kacie D | -- | Valmer Land Title Agency Box | |
| Neal Jerry D | $11,500 | Valmer Land Title Agency Box |
Source: Public Records
Mortgage History
| Date | Status | Borrower | Loan Amount |
|---|---|---|---|
| Open | Kauffeld Jenniffer P | $56,000 |
Source: Public Records
Tax History
| Year | Tax Paid | Tax Assessment Tax Assessment Total Assessment is a certain percentage of the fair market value that is determined by local assessors to be the total taxable value of land and additions on the property. | Land | Improvement |
|---|---|---|---|---|
| 2025 | $4,683 | $90,730 | $22,520 | $68,210 |
| 2024 | $4,683 | $90,730 | $22,520 | $68,210 |
| 2023 | $3,503 | $90,730 | $22,520 | $68,210 |
| 2022 | $2,705 | $64,400 | $15,020 | $49,380 |
| 2021 | $2,713 | $64,400 | $15,020 | $49,380 |
| 2020 | $2,714 | $64,400 | $15,020 | $49,380 |
| 2019 | $2,439 | $56,240 | $14,290 | $41,950 |
| 2018 | $2,253 | $56,240 | $14,290 | $41,950 |
| 2017 | $2,313 | $56,240 | $14,290 | $41,950 |
| 2016 | $2,131 | $53,070 | $13,610 | $39,460 |
| 2015 | $890 | $53,070 | $13,610 | $39,460 |
| 2014 | $1,783 | $53,070 | $13,610 | $39,460 |
| 2013 | $1,860 | $53,200 | $13,610 | $39,590 |
Source: Public Records
Map
Nearby Homes
- 1520 Hiner Rd
- 1490 Hiner Rd
- 1470 Hiner Rd
- 9174 Constitution Ave
- 1319 Hiner Rd
- 1690 Lynnbrook Ct
- 1800 Lynnbrook Ct
- 302 Shady Hollow Dr
- 1736 Harvey Ln
- 6444 Autumn Blaze
- 1717 London Groveport Rd
- 1439 River Trail Dr
- 1352 River Trail Dr
- 38 Waterman Ave
- 326 Merion Dr
- 352 Oakmont Dr
- 6358 Shawnee St
- 6321 Windcliff Dr
- 341 Merion Dr
- 444 Bethpage Blvd
- 9151 Mccord Rd
- 9085 Mccord Rd
- 9096 Mccord Rd
- 9155 Mccord Rd
- 9136 Mccord Rd
- 1635 Hiner Rd
- 9040 Mccord Rd
- 1585 Hiner Rd
- 1557 Hiner Rd
- 9217 Mccord Rd
- 9206 Mccord Rd
- 1655 Hiner Rd
- 5800 Mattox Cir
- 1643 Hiner Rd
- 5790 Mattox Cir
- 5790 Mattox Cir Unit 330
- 5820 Mattox Cir
- 5810 Mattox Cir Unit 328
- 5830 Mattox Cir
- 1665 Hiner Rd
Your Personal Tour Guide
Ask me questions while you tour the home.