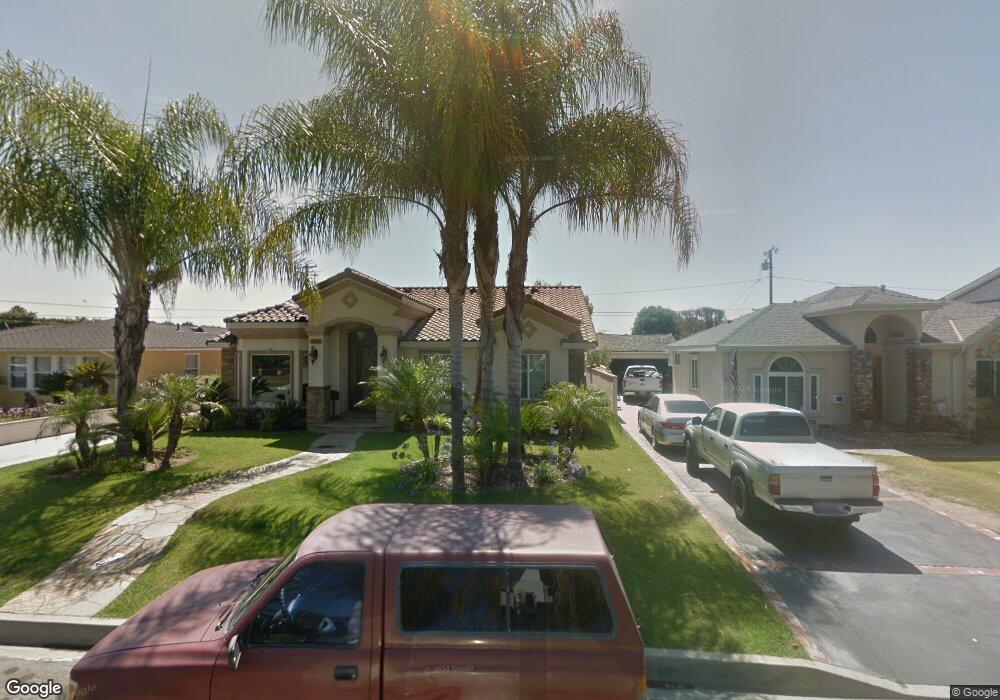
9116 Chaney Ave Downey, CA 90240
Estimated Value: $886,000 - $1,355,000
4
Beds
3
Baths
2,642
Sq Ft
$434/Sq Ft
Est. Value
About This Home
This home is located at 9116 Chaney Ave, Downey, CA 90240 and is currently estimated at $1,147,271, approximately $434 per square foot. 9116 Chaney Ave is a home located in Los Angeles County with nearby schools including Rio San Gabriel Elementary School, Doty Middle School, and Downey High School.
Ownership History
Date
Name
Owned For
Owner Type
Purchase Details
Closed on
Dec 12, 2016
Sold by
Zamora Eugene
Bought by
Garay Margarita and Zamora Margarita G
Current Estimated Value
Purchase Details
Closed on
Jul 21, 2006
Sold by
Zamora Eugene and Zamora Margarita
Bought by
Zamora Eugene and Zamora Margarita G
Home Financials for this Owner
Home Financials are based on the most recent Mortgage that was taken out on this home.
Original Mortgage
$417,000
Outstanding Balance
$246,467
Interest Rate
6.57%
Mortgage Type
New Conventional
Estimated Equity
$900,804
Purchase Details
Closed on
Aug 31, 1999
Sold by
Bright David P and Bright Denise M
Bought by
Zamora Eugene and Zamora Margarita
Home Financials for this Owner
Home Financials are based on the most recent Mortgage that was taken out on this home.
Original Mortgage
$200,348
Interest Rate
7.76%
Mortgage Type
FHA
Create a Home Valuation Report for This Property
The Home Valuation Report is an in-depth analysis detailing your home's value as well as a comparison with similar homes in the area
Purchase History
| Date | Buyer | Sale Price | Title Company |
|---|---|---|---|
| Garay Margarita | -- | None Available | |
| Zamora Eugene | -- | Stewart Title Of California | |
| Zamora Eugene | $202,000 | Fidelity Title |
Source: Public Records
Mortgage History
| Date | Status | Borrower | Loan Amount |
|---|---|---|---|
| Open | Zamora Eugene | $417,000 | |
| Closed | Zamora Eugene | $200,348 |
Source: Public Records
Tax History
| Year | Tax Paid | Tax Assessment Tax Assessment Total Assessment is a certain percentage of the fair market value that is determined by local assessors to be the total taxable value of land and additions on the property. | Land | Improvement |
|---|---|---|---|---|
| 2025 | $7,104 | $559,436 | $223,158 | $336,278 |
| 2024 | $7,104 | $548,468 | $218,783 | $329,685 |
| 2023 | $6,866 | $537,715 | $214,494 | $323,221 |
| 2022 | $6,526 | $527,173 | $210,289 | $316,884 |
| 2021 | $6,377 | $516,837 | $206,166 | $310,671 |
| 2019 | $6,214 | $501,509 | $200,052 | $301,457 |
| 2018 | $5,992 | $491,677 | $196,130 | $295,547 |
| 2016 | $5,796 | $472,586 | $188,515 | $284,071 |
| 2015 | $5,714 | $465,488 | $185,684 | $279,804 |
| 2014 | $5,393 | $456,371 | $182,047 | $274,324 |
Source: Public Records
Map
Nearby Homes
- 9145 Raviller Dr
- 9069 Gallatin Rd
- 9017 Arrington Ave
- 9225 Sideview Dr
- 8611 Eglise Ave
- 8604 Whittle Ct
- 9378 Suva St
- 9125 Gainford St
- 9636 Cedartree Rd
- 9246 Manzanar Ave
- 8414 Cravell Ave
- 8844 True Ave
- 8328 Buhman Ave
- 9363 Dinsdale St
- 9434 Pico Vista Rd
- 8806 Stamps Rd
- 7354 Diamond Dr
- 7344 Diamond Dr
- 10214 Woodruff Ave
- 9734 Terradell St
- 9122 Chaney Ave
- 9110 Chaney Ave
- 9102 Chaney Ave
- 9128 Chaney Ave
- 9107 Lemoran Ave
- 9113 Lemoran Ave
- 9103 Lemoran Ave
- 9134 Chaney Ave
- 9117 Lemoran Ave
- 9117 Chaney Ave
- 9123 Chaney Ave
- 9111 Chaney Ave
- 9129 Chaney Ave
- 9107 Chaney Ave
- 9202 Chaney Ave
- 9103 Chaney Ave
- 9135 Chaney Ave
- 9129 Lemoran Ave
- 9208 Chaney Ave
- 9135 Lemoran Ave
Your Personal Tour Guide
Ask me questions while you tour the home.