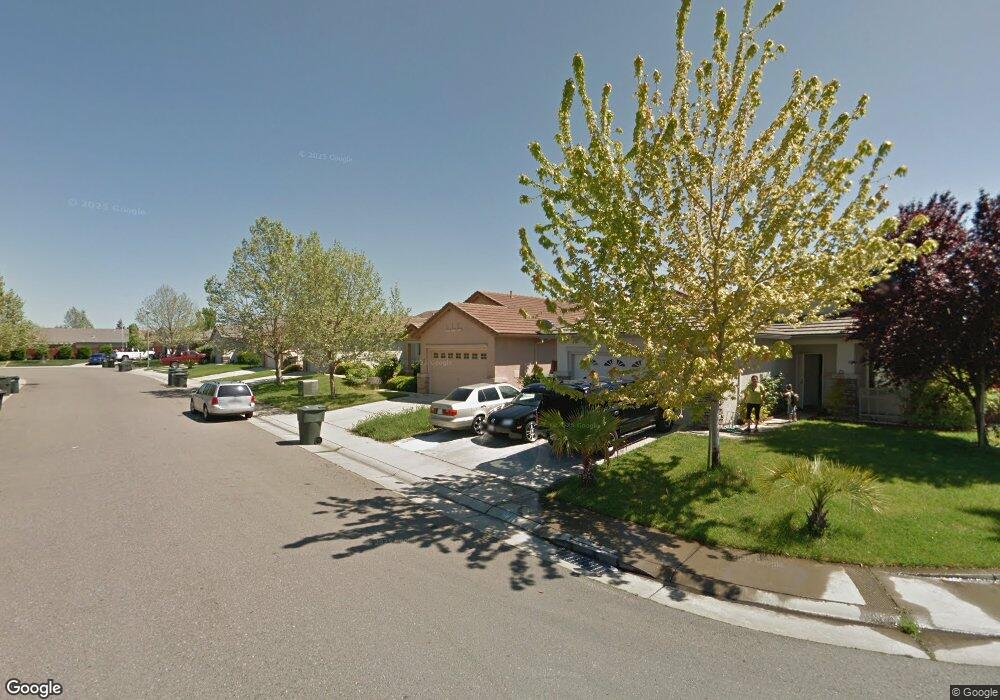
9118 Callock Ct Sacramento, CA 95829
Estimated Value: $398,000 - $560,000
4
Beds
2
Baths
1,577
Sq Ft
$319/Sq Ft
Est. Value
About This Home
This home is located at 9118 Callock Ct, Sacramento, CA 95829 and is currently estimated at $503,328, approximately $319 per square foot. 9118 Callock Ct is a home located in Sacramento County with nearby schools including Maeola E. Beitzel Elementary School, T. R. Smedberg Middle School, and Sheldon High School.
Ownership History
Date
Name
Owned For
Owner Type
Purchase Details
Closed on
May 30, 2014
Sold by
Thr California Lp
Bought by
2014-1 Ih Borrower Lp
Current Estimated Value
Home Financials for this Owner
Home Financials are based on the most recent Mortgage that was taken out on this home.
Original Mortgage
$993,738,000
Outstanding Balance
$757,278,384
Interest Rate
4.25%
Mortgage Type
Stand Alone Refi Refinance Of Original Loan
Estimated Equity
-$756,775,056
Purchase Details
Closed on
Nov 29, 2012
Sold by
Melocoton Frederick Gamao
Bought by
Calilfornia Partnership
Purchase Details
Closed on
Nov 20, 2012
Sold by
Melocoton Frederick Gamao
Bought by
Thr California Llc
Purchase Details
Closed on
Dec 12, 2001
Sold by
Elliott Homes Inc
Bought by
Melocoton Frederick Gamao
Home Financials for this Owner
Home Financials are based on the most recent Mortgage that was taken out on this home.
Original Mortgage
$140,000
Interest Rate
6.57%
Create a Home Valuation Report for This Property
The Home Valuation Report is an in-depth analysis detailing your home's value as well as a comparison with similar homes in the area
Home Values in the Area
Average Home Value in this Area
Purchase History
| Date | Buyer | Sale Price | Title Company |
|---|---|---|---|
| 2014-1 Ih Borrower Lp | -- | None Available | |
| Calilfornia Partnership | $169,000 | None Available | |
| Thr California Llc | $169,000 | None Available | |
| Melocoton Frederick Gamao | $199,000 | Stewart Title | |
| Elliott Homes Inc | $19,000 | Stewart Title |
Source: Public Records
Mortgage History
| Date | Status | Borrower | Loan Amount |
|---|---|---|---|
| Open | 2014-1 Ih Borrower Lp | $993,738,000 | |
| Previous Owner | Elliott Homes Inc | $140,000 |
Source: Public Records
Tax History Compared to Growth
Tax History
| Year | Tax Paid | Tax Assessment Tax Assessment Total Assessment is a certain percentage of the fair market value that is determined by local assessors to be the total taxable value of land and additions on the property. | Land | Improvement |
|---|---|---|---|---|
| 2025 | $4,115 | $371,381 | $127,661 | $243,720 |
| 2024 | $4,115 | $364,100 | $125,158 | $238,942 |
| 2023 | $4,013 | $356,961 | $122,704 | $234,257 |
| 2022 | $3,946 | $349,963 | $120,299 | $229,664 |
| 2021 | $3,904 | $343,102 | $117,941 | $225,161 |
| 2020 | $3,853 | $339,585 | $116,732 | $222,853 |
| 2019 | $3,784 | $332,928 | $114,444 | $218,484 |
| 2018 | $2,475 | $211,036 | $64,934 | $146,102 |
| 2017 | $2,435 | $206,899 | $63,661 | $143,238 |
| 2016 | $2,319 | $202,843 | $62,413 | $140,430 |
| 2015 | $2,278 | $199,797 | $61,476 | $138,321 |
| 2014 | $2,243 | $195,884 | $60,272 | $135,612 |
Source: Public Records
Map
Nearby Homes
- 9120 Giant Panda Dr
- 7984 Munhall Ct
- 7904 Symington Way
- 7929 Symington Way
- 8054 Boeger Ct
- 8048 Caymus Dr
- 8977 Carlisle Ave
- 9172 Durness Way
- 9244 Brevard Ct
- 7926 Asiatic Lion Ct
- 9040 Durness Way
- 9273 Amarone Way
- 8880 Sonoma Valley Way
- 9287 Benefield Ct
- 8932 Caselman Rd
- 9028 Brittany Park Dr
- 8916 Hollowstone Way
- 8901 Leland Ave
- 9169 Garlington Ct
- 8005 Delage Way
- 9122 Callock Ct
- 9114 Callock Ct
- 9126 Callock Ct
- 9119 Hemsworth Way
- 9115 Hemsworth Way
- 9130 Callock Ct
- 9123 Hemsworth Way
- 9119 Callock Ct
- 9123 Callock Ct
- 9115 Callock Ct
- 7968 Marsannay Way
- 7972 Marsannay Way
- 9127 Callock Ct
- 7964 Marsannay Way
- 9134 Callock Ct
- 9127 Hemsworth Way
- 7976 Marsannay Way
- 7960 Marsannay Way
- 9131 Callock Ct
- 7980 Marsannay Way