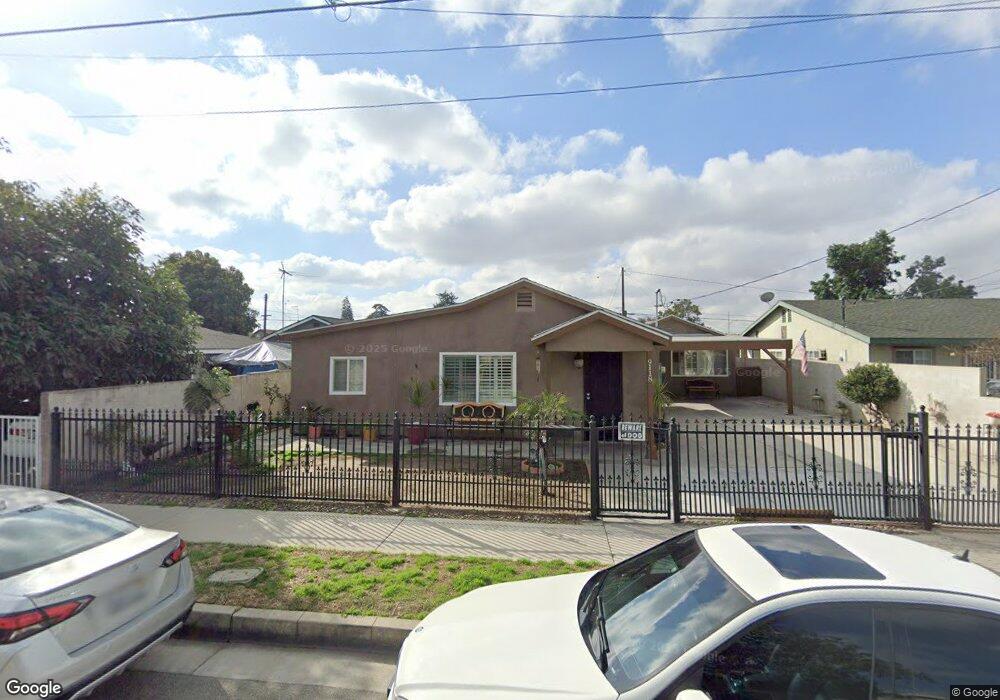
9118 Union St Pico Rivera, CA 90660
Estimated Value: $641,000 - $671,305
3
Beds
1
Bath
945
Sq Ft
$695/Sq Ft
Est. Value
About This Home
This home is located at 9118 Union St, Pico Rivera, CA 90660 and is currently estimated at $656,326, approximately $694 per square foot. 9118 Union St is a home located in Los Angeles County with nearby schools including North Ranchito Elementary School, North Park Middle School, and Ruben Salazar Continuation School.
Ownership History
Date
Name
Owned For
Owner Type
Purchase Details
Closed on
Oct 18, 2010
Sold by
West Coast Servicing Inc
Bought by
Servin Aldo and Servin Bertha A
Current Estimated Value
Home Financials for this Owner
Home Financials are based on the most recent Mortgage that was taken out on this home.
Original Mortgage
$238,789
Outstanding Balance
$156,772
Interest Rate
4.25%
Mortgage Type
FHA
Estimated Equity
$499,554
Purchase Details
Closed on
Jun 9, 2010
Sold by
Segura Juan
Bought by
West Coast Servicing Inc
Purchase Details
Closed on
Jan 31, 2008
Sold by
Garcia Trinidad and Garcia Maria Dejesus
Bought by
Segura Juan
Home Financials for this Owner
Home Financials are based on the most recent Mortgage that was taken out on this home.
Original Mortgage
$389,500
Interest Rate
6.25%
Mortgage Type
Purchase Money Mortgage
Purchase Details
Closed on
Jan 12, 2006
Sold by
Garcia Trinidad and Garcia Maria De Jesus
Bought by
Garcia Trinidad
Create a Home Valuation Report for This Property
The Home Valuation Report is an in-depth analysis detailing your home's value as well as a comparison with similar homes in the area
Home Values in the Area
Average Home Value in this Area
Purchase History
| Date | Buyer | Sale Price | Title Company |
|---|---|---|---|
| Servin Aldo | $245,000 | Lawyers Title | |
| West Coast Servicing Inc | $200,000 | Accommodation | |
| Segura Juan | $410,000 | None Available | |
| Garcia Trinidad | -- | None Available |
Source: Public Records
Mortgage History
| Date | Status | Borrower | Loan Amount |
|---|---|---|---|
| Open | Servin Aldo | $238,789 | |
| Previous Owner | Segura Juan | $389,500 |
Source: Public Records
Tax History
| Year | Tax Paid | Tax Assessment Tax Assessment Total Assessment is a certain percentage of the fair market value that is determined by local assessors to be the total taxable value of land and additions on the property. | Land | Improvement |
|---|---|---|---|---|
| 2025 | $4,590 | $313,875 | $226,762 | $87,113 |
| 2024 | $4,590 | $307,721 | $222,316 | $85,405 |
| 2023 | $4,463 | $301,688 | $217,957 | $83,731 |
| 2022 | $4,263 | $295,774 | $213,684 | $82,090 |
| 2021 | $4,151 | $289,976 | $209,495 | $80,481 |
| 2019 | $4,120 | $281,377 | $203,282 | $78,095 |
| 2018 | $3,887 | $275,861 | $199,297 | $76,564 |
| 2016 | $3,513 | $265,151 | $191,559 | $73,592 |
| 2015 | $3,460 | $261,169 | $188,682 | $72,487 |
| 2014 | $3,417 | $256,054 | $184,986 | $71,068 |
Source: Public Records
Map
Nearby Homes
- 9035 Hightree St
- 9323 Via Azul
- 9327 Via Azul
- 4918 Rosemead Blvd
- 9318 Via Azul
- 9329 Via Azul
- 9335 Via Azul
- 9324 Via Azul
- 9367 Via Azul
- 4508 Deland Ave
- 4660 Paramount Blvd
- 5101 Lindsey Ave
- 8630 Elba St
- 9419 Beverly Blvd
- 4288 Rosemead Blvd Unit 25
- 5313 Manzanar Ave
- 9203 Loch Lomond Dr
- 4424 Calada Ave
- 5259 Calico Ave
- 9530 Underwood St
- 9124 Union St
- 9112 Union St
- 9115 Union St
- 9104 Union St
- 9113 Hightree St
- 9107 Hightree St
- 9117 Hightree St
- 4758 Walnut Ave
- 9121 Union St
- 9103 Hightree St
- 4754 Walnut Ave
- 9030 Union St
- 9123 Hightree St
- 4748 Walnut Ave
- 9029 Hightree St
- 9020 Union St
- 9127 Hightree St
- 4744 Walnut Ave
- 9118 Hightree St
- 8824 Pico Rivera
Your Personal Tour Guide
Ask me questions while you tour the home.