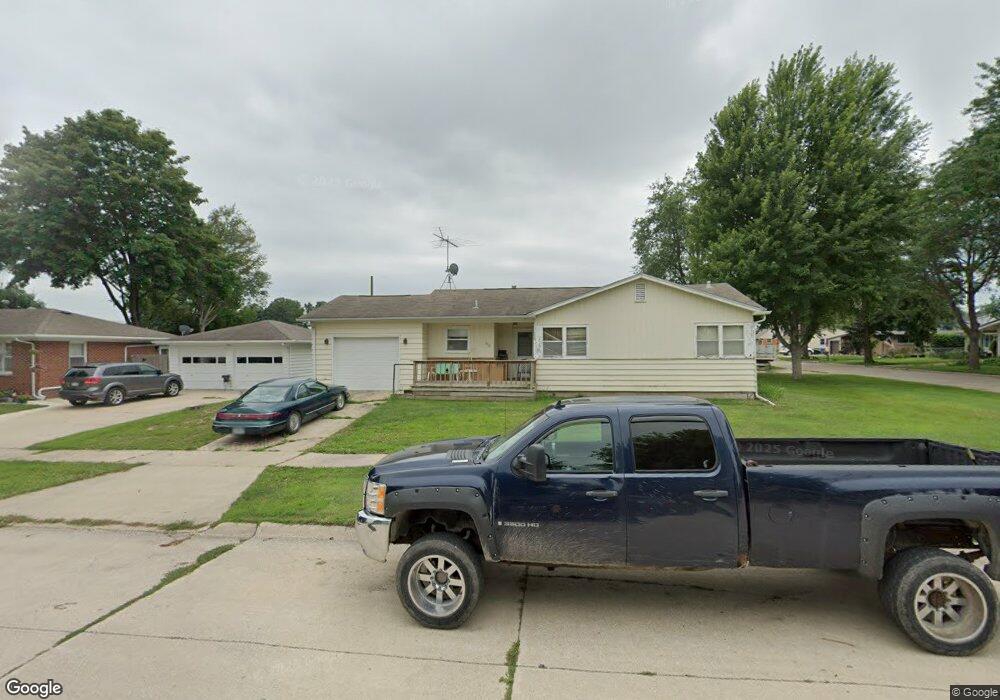
912 8th St Charles City, IA 50616
Estimated Value: $126,000 - $143,627
3
Beds
3
Baths
1,051
Sq Ft
$129/Sq Ft
Est. Value
About This Home
This home is located at 912 8th St, Charles City, IA 50616 and is currently estimated at $135,407, approximately $128 per square foot. 912 8th St is a home located in Floyd County with nearby schools including Charles City High School and Immaculate Conception School.
Ownership History
Date
Name
Owned For
Owner Type
Purchase Details
Closed on
Feb 6, 2013
Sold by
City Of Charles City
Bought by
Parkside Development L L C
Current Estimated Value
Purchase Details
Closed on
Aug 21, 2007
Sold by
Meyer Margaret A
Bought by
Bock David A
Home Financials for this Owner
Home Financials are based on the most recent Mortgage that was taken out on this home.
Original Mortgage
$78,000
Interest Rate
6.77%
Mortgage Type
Future Advance Clause Open End Mortgage
Create a Home Valuation Report for This Property
The Home Valuation Report is an in-depth analysis detailing your home's value as well as a comparison with similar homes in the area
Home Values in the Area
Average Home Value in this Area
Purchase History
| Date | Buyer | Sale Price | Title Company |
|---|---|---|---|
| Parkside Development L L C | -- | None Available | |
| Bock David A | $78,000 | None Available |
Source: Public Records
Mortgage History
| Date | Status | Borrower | Loan Amount |
|---|---|---|---|
| Previous Owner | Bock David A | $78,000 |
Source: Public Records
Tax History Compared to Growth
Tax History
| Year | Tax Paid | Tax Assessment Tax Assessment Total Assessment is a certain percentage of the fair market value that is determined by local assessors to be the total taxable value of land and additions on the property. | Land | Improvement |
|---|---|---|---|---|
| 2025 | $1,882 | $110,860 | $17,640 | $93,220 |
| 2024 | $1,882 | $115,920 | $17,640 | $98,280 |
| 2023 | $1,674 | $115,920 | $17,640 | $98,280 |
| 2022 | $1,666 | $88,250 | $17,640 | $70,610 |
| 2021 | $1,684 | $88,250 | $17,640 | $70,610 |
| 2020 | $1,684 | $88,250 | $17,640 | $70,610 |
| 2019 | $1,596 | $85,690 | $17,640 | $68,050 |
| 2018 | $1,484 | $83,460 | $17,640 | $65,820 |
| 2017 | $1,546 | $83,460 | $17,640 | $65,820 |
| 2016 | $1,516 | $83,460 | $17,640 | $65,820 |
| 2015 | $1,516 | $84,830 | $17,640 | $67,190 |
| 2014 | $1,550 | $84,830 | $17,640 | $67,190 |
Source: Public Records
Map
Nearby Homes