Estimated Value: $556,000 - $599,000
3
Beds
3
Baths
2,104
Sq Ft
$274/Sq Ft
Est. Value
About This Home
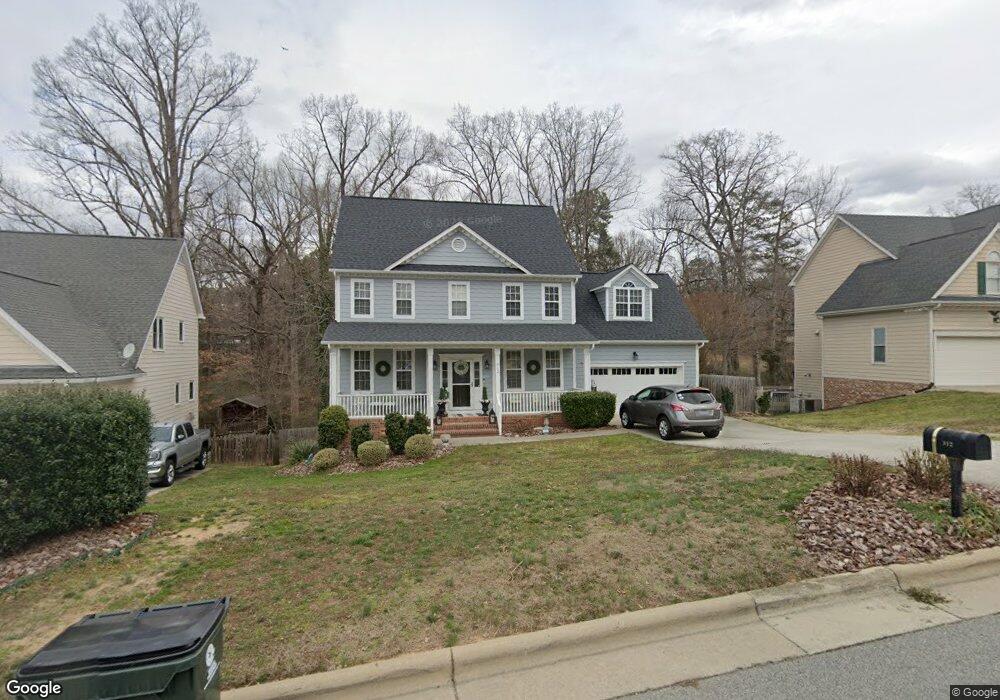
This home is located at 912 Brittley Way, Apex, NC 27502 and is currently estimated at $575,445, approximately $273 per square foot. 912 Brittley Way is a home located in Wake County with nearby schools including Salem Elementary, Salem Middle, and Apex High School.
Ownership History
Date
Name
Owned For
Owner Type
Purchase Details
Closed on
Apr 17, 2019
Sold by
Henry Anita K
Bought by
Kolander Angela Marie and Evans Robert M
Current Estimated Value
Home Financials for this Owner
Home Financials are based on the most recent Mortgage that was taken out on this home.
Original Mortgage
$256,000
Outstanding Balance
$166,626
Interest Rate
4.4%
Mortgage Type
New Conventional
Estimated Equity
$408,819
Purchase Details
Closed on
Sep 18, 2013
Sold by
Kimbro Charles D and Kimbro Lori Lynn
Bought by
Henry Anita K
Home Financials for this Owner
Home Financials are based on the most recent Mortgage that was taken out on this home.
Original Mortgage
$160,000
Interest Rate
3.43%
Mortgage Type
New Conventional
Purchase Details
Closed on
Aug 6, 1998
Sold by
Park Homes Inc
Bought by
Kimbro Charles D and Kimbro Tracy A
Home Financials for this Owner
Home Financials are based on the most recent Mortgage that was taken out on this home.
Original Mortgage
$146,100
Interest Rate
6.97%
Create a Home Valuation Report for This Property
The Home Valuation Report is an in-depth analysis detailing your home's value as well as a comparison with similar homes in the area
Home Values in the Area
Average Home Value in this Area
Purchase History
| Date | Buyer | Sale Price | Title Company |
|---|---|---|---|
| Kolander Angela Marie | $320,000 | None Available | |
| Kolander Angela Marie | $320,000 | None Listed On Document | |
| Henry Anita K | $250,000 | None Available | |
| Kimbro Charles D | $189,000 | -- |
Source: Public Records
Mortgage History
| Date | Status | Borrower | Loan Amount |
|---|---|---|---|
| Open | Kolander Angela Marie | $256,000 | |
| Closed | Kolander Angela Marie | $256,000 | |
| Previous Owner | Henry Anita K | $160,000 | |
| Previous Owner | Kimbro Charles D | $146,100 |
Source: Public Records
Tax History Compared to Growth
Tax History
| Year | Tax Paid | Tax Assessment Tax Assessment Total Assessment is a certain percentage of the fair market value that is determined by local assessors to be the total taxable value of land and additions on the property. | Land | Improvement |
|---|---|---|---|---|
| 2025 | $4,514 | $514,706 | $170,000 | $344,706 |
| 2024 | $4,413 | $514,706 | $170,000 | $344,706 |
| 2023 | $3,714 | $336,692 | $90,000 | $246,692 |
| 2022 | $3,486 | $336,692 | $90,000 | $246,692 |
| 2021 | $3,353 | $336,692 | $90,000 | $246,692 |
| 2020 | $3,320 | $336,692 | $90,000 | $246,692 |
| 2019 | $3,470 | $303,786 | $112,500 | $191,286 |
| 2018 | $3,269 | $303,786 | $112,500 | $191,286 |
| 2017 | $3,043 | $303,786 | $112,500 | $191,286 |
| 2016 | $2,999 | $303,786 | $112,500 | $191,286 |
| 2015 | $2,690 | $265,814 | $74,000 | $191,814 |
| 2014 | $2,593 | $265,814 | $74,000 | $191,814 |
Source: Public Records
Map
Nearby Homes
- 303 Knightsborough Way
- 919 Branch Line Ln
- 907 Haddon Hall Dr
- 953 Ambergate Station
- 1111 Platform Dr
- 1115 Platform Dr
- 996 Tender Dr
- 547 Grand Central Station
- 596 Grand Central Station
- 1209 Haywards Heath Ln
- 1808 N Salem St
- 903 Norwood Ln
- 506 W Chatham St
- 102 Darley Dale Loop
- 232 Eyam Hall Ln
- 235 Eyam Hall Ln
- 427 Eyam Hall Ln
- 1000 Oakgate Ct
- 202 W Chatham St
- 7736 Roberts Rd
- 910 Brittley Way
- 914 Brittley Way
- 908 Brittley Way
- 916 Brittley Way
- 911 Brittley Way
- 913 Brittley Way
- 906 Brittley Way
- 909 Brittley Way
- 918 Brittley Way
- 917 Brittley Way
- 905 Brittley Way
- 904 Brittley Way
- 1005 Obridge Ct
- 1003 Obridge Ct
- 920 Brittley Way
- 1004 Obridge Ct
- 1100 Frenchurch Way
- 901 Brittley Way
- 902 Brittley Way
- 1010 Rexhill Ct