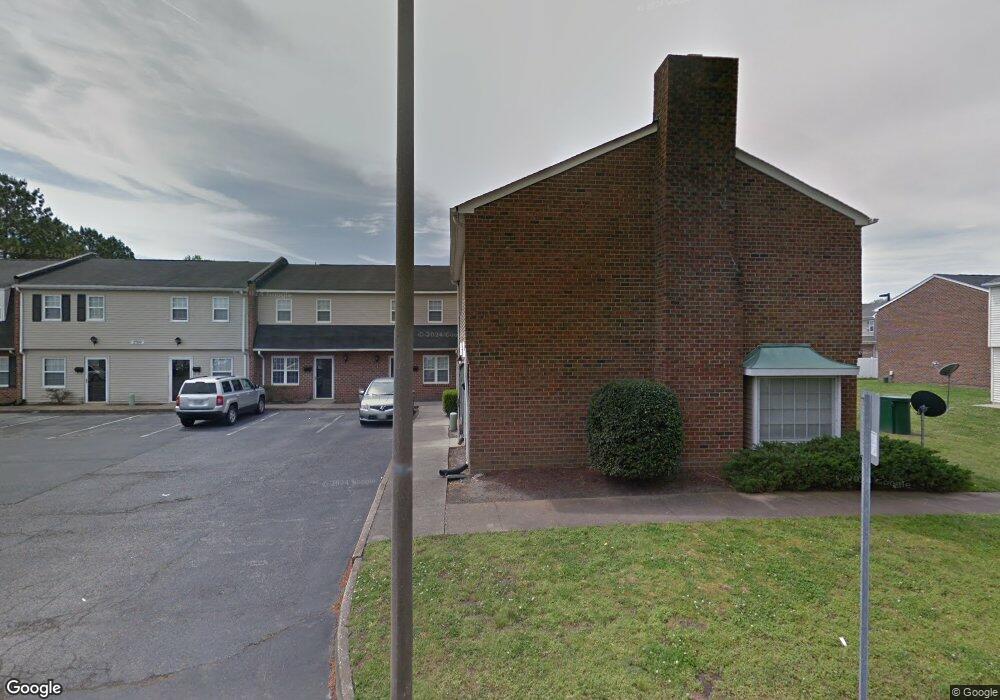
912 Deep Branch Way Chesapeake, VA 23323
Deep Creek NeighborhoodEstimated Value: $248,000 - $259,000
3
Beds
3
Baths
1,513
Sq Ft
$167/Sq Ft
Est. Value
About This Home
This home is located at 912 Deep Branch Way, Chesapeake, VA 23323 and is currently estimated at $252,995, approximately $167 per square foot. 912 Deep Branch Way is a home located in Chesapeake City with nearby schools including G.A. Treakle Elementary School, Deep Creek Middle School, and Deep Creek High.
Ownership History
Date
Name
Owned For
Owner Type
Purchase Details
Closed on
Sep 23, 2020
Sold by
Clark Richard Morris Obrecht and Clark Lusinda
Bought by
Brown Monica
Current Estimated Value
Home Financials for this Owner
Home Financials are based on the most recent Mortgage that was taken out on this home.
Original Mortgage
$177,560
Outstanding Balance
$157,573
Interest Rate
2.9%
Mortgage Type
FHA
Estimated Equity
$95,422
Purchase Details
Closed on
Dec 5, 2018
Sold by
Wells Sydney M
Bought by
Clark Richard Morris Obrecht and Clark Lusinda
Home Financials for this Owner
Home Financials are based on the most recent Mortgage that was taken out on this home.
Original Mortgage
$179,225
Interest Rate
4.8%
Mortgage Type
VA
Purchase Details
Closed on
Sep 18, 2014
Sold by
Ashdon Builders Inc
Bought by
Wells Sydney M
Home Financials for this Owner
Home Financials are based on the most recent Mortgage that was taken out on this home.
Original Mortgage
$159,953
Interest Rate
4.14%
Mortgage Type
New Conventional
Create a Home Valuation Report for This Property
The Home Valuation Report is an in-depth analysis detailing your home's value as well as a comparison with similar homes in the area
Home Values in the Area
Average Home Value in this Area
Purchase History
| Date | Buyer | Sale Price | Title Company |
|---|---|---|---|
| Brown Monica | $184,000 | Accommodation | |
| Clark Richard Morris Obrecht | $173,500 | Title Alliance Greenbrier | |
| Wells Sydney M | $164,900 | -- |
Source: Public Records
Mortgage History
| Date | Status | Borrower | Loan Amount |
|---|---|---|---|
| Open | Brown Monica | $177,560 | |
| Previous Owner | Clark Richard Morris Obrecht | $179,225 | |
| Previous Owner | Wells Sydney M | $159,953 |
Source: Public Records
Tax History
| Year | Tax Paid | Tax Assessment Tax Assessment Total Assessment is a certain percentage of the fair market value that is determined by local assessors to be the total taxable value of land and additions on the property. | Land | Improvement |
|---|---|---|---|---|
| 2025 | $2,389 | $243,800 | $80,000 | $163,800 |
| 2024 | $2,389 | $236,500 | $75,000 | $161,500 |
| 2023 | $2,011 | $220,500 | $70,000 | $150,500 |
| 2022 | $1,959 | $194,000 | $55,000 | $139,000 |
| 2021 | $1,899 | $180,900 | $50,000 | $130,900 |
| 2020 | $1,786 | $170,100 | $50,000 | $120,100 |
| 2019 | $1,652 | $157,300 | $40,000 | $117,300 |
| 2018 | $1,632 | $157,900 | $35,000 | $122,900 |
| 2017 | $1,632 | $155,400 | $35,000 | $120,400 |
| 2016 | $1,658 | $157,900 | $35,000 | $122,900 |
| 2015 | $1,657 | $157,800 | $35,000 | $122,800 |
| 2014 | $1,712 | $163,000 | $35,000 | $128,000 |
Source: Public Records
Map
Nearby Homes
- 924 Deep Branch Way
- 2722 Janice Lynn Ct
- 901 King Arthur Dr
- 909 King Arthur Dr
- 2507 Sunset Dr
- 2685 Powell Cir
- 2819 Eric Ct
- 820 Henry Ave
- 2411 Youngman Rd
- 2410 Payne Rd
- 809 Parapet Rd
- 2552 Roundtree Cir
- 1101 Kenelm Ct
- 2645 Roundtree Cir
- 2315 Cross St
- 3244 Sir Meliot Dr
- 2812 Flag Rd
- 2717 Thomas St
- 2213 Tennessee Dr
- 3204 Bruno Dr
- 908 Deep Branch Way
- 916 Deep Branch Way
- 920 Deep Branch Way
- 913 Deep Creek Run
- 917 Deep Creek Run
- 909 Deep Creek Run
- 921 Deep Creek Run
- 905 Deep Creek Run
- 925 Deep Creek Run
- 909 Deep Branch Way
- 917 Deep Branch Way
- 905 Deep Branch Way
- 921 Deep Branch Way
- 901 Deep Branch Way
- 925 Deep Branch Way
- 2729 Deep Creek Common
- 2729 Deep Creek Common
- 2725 Deep Creek Common
- 2733 Deep Creek Common
- 2721 Deep Creek Common
Your Personal Tour Guide
Ask me questions while you tour the home.