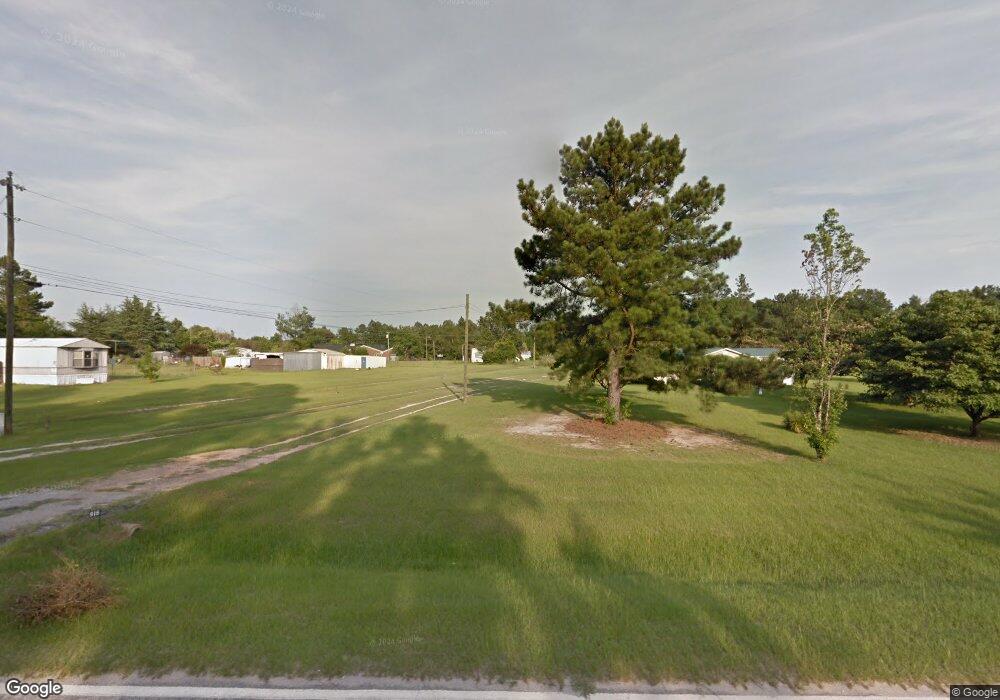
912 Horseshoe Rd Augusta, GA 30906
Estimated Value: $99,538 - $139,000
Studio
--
Bath
1,680
Sq Ft
$74/Sq Ft
Est. Value
About This Home
This home is located at 912 Horseshoe Rd, Augusta, GA 30906 and is currently estimated at $125,135, approximately $74 per square foot. 912 Horseshoe Rd is a home located in Richmond County with nearby schools including McBean Elementary School, Pine Hill Middle School, and Johnson Magnet.
Ownership History
Date
Name
Owned For
Owner Type
Purchase Details
Closed on
May 30, 2001
Sold by
King Mill Svgs & Credit Assn
Bought by
Lightsey Marvin L and Lightsey Barbara J
Current Estimated Value
Home Financials for this Owner
Home Financials are based on the most recent Mortgage that was taken out on this home.
Original Mortgage
$32,500
Interest Rate
7.1%
Purchase Details
Closed on
May 1, 2001
Sold by
Blackwell James S
Bought by
King Mill Savings And Loan Association
Home Financials for this Owner
Home Financials are based on the most recent Mortgage that was taken out on this home.
Original Mortgage
$32,500
Interest Rate
7.1%
Purchase Details
Closed on
Apr 20, 1999
Sold by
Howard Rosemary
Bought by
Blackwell James S and Blackwell Sally
Home Financials for this Owner
Home Financials are based on the most recent Mortgage that was taken out on this home.
Original Mortgage
$25,200
Interest Rate
7.06%
Purchase Details
Closed on
Dec 13, 1993
Sold by
Holloway Joyce A
Bought by
Howard Rosemary
Purchase Details
Closed on
Nov 6, 1990
Sold by
Fleet Finance & Mor
Bought by
Holloway Joyce A
Create a Home Valuation Report for This Property
The Home Valuation Report is an in-depth analysis detailing your home's value as well as a comparison with similar homes in the area
Purchase History
| Date | Buyer | Sale Price | Title Company |
|---|---|---|---|
| Lightsey Marvin L | $42,600 | -- | |
| Lightsey Marvin L | $42,600 | -- | |
| King Mill Savings And Loan Association | $36,500 | -- | |
| Blackwell James S | $28,000 | -- | |
| Howard Rosemary | $10,500 | -- | |
| Holloway Joyce A | $9,500 | -- |
Source: Public Records
Mortgage History
| Date | Status | Borrower | Loan Amount |
|---|---|---|---|
| Previous Owner | Lightsey Marvin L | $32,500 | |
| Previous Owner | Blackwell James S | $25,200 | |
| Closed | Blackwell James S | $1,400 |
Source: Public Records
Tax History
| Year | Tax Paid | Tax Assessment Tax Assessment Total Assessment is a certain percentage of the fair market value that is determined by local assessors to be the total taxable value of land and additions on the property. | Land | Improvement |
|---|---|---|---|---|
| 2025 | $532 | $9,182 | $5,920 | $3,262 |
| 2024 | $532 | $9,182 | $5,920 | $3,262 |
| 2023 | $321 | $9,376 | $5,920 | $3,456 |
| 2022 | $418 | $8,853 | $5,920 | $2,933 |
| 2021 | $429 | $8,853 | $5,920 | $2,933 |
| 2020 | $432 | $9,033 | $5,920 | $3,113 |
| 2019 | $492 | $10,595 | $5,920 | $4,675 |
| 2018 | $499 | $10,773 | $5,920 | $4,853 |
| 2017 | $506 | $11,018 | $5,920 | $5,098 |
| 2016 | $514 | $11,271 | $5,920 | $5,351 |
| 2015 | $522 | $11,457 | $5,920 | $5,537 |
| 2014 | $519 | $11,340 | $5,920 | $5,420 |
Source: Public Records
Map
Nearby Homes
- 937 Bennock Mill Rd
- 979 Horseshoe Rd
- 1029 Horseshoe B Rd
- 1049 Horseshoe Rd
- 1045 Horseshoe Rd
- 4756 Mike Padgett Hwy
- 1261 Alden Dr
- 4546 Mike Padgett Hwy
- 1001 Alden Dr
- 4684 Rollins Rd Unit 2
- 4684 Rollins Rd
- 1131 Piney Grove Rd
- 1140 Piney Grove Rd
- 925 Hephzibah McBean Rd
- 7042 Amarillo Cir
- 1469 Clark Rd
- 1106B Hephzibah - McBean Rd
- 1233 Paramount Ct
- 1573 Oglethorpe Dr
- 2003 Broome Rd
- 914 Horseshoe Rd
- 910 Horseshoe Rd
- 872 Bennock Mill Rd
- 920 Horseshoe Rd
- 922 Horseshoe Rd
- 2031 Bennock Mill Loop
- 2031 Bennock Mill Loop
- 864 Bennock Mill Rd
- 926 Horseshoe Rd
- 924 Horseshoe Rd
- 906 Horseshoe Rd
- 870 Bennock Mill Rd
- 858 Bennock Mill Rd
- 2035 Bennock Mill Loop
- 868 A Bennock Mill Rd
- 2033 Bennock Mill Road Loop
- 904 Horseshoe Rd
- 907 Horseshoe Rd
- 2035 Bennock Mill Road Loop
- 930 Horseshoe Rd Unit A / 002
Your Personal Tour Guide
Ask me questions while you tour the home.