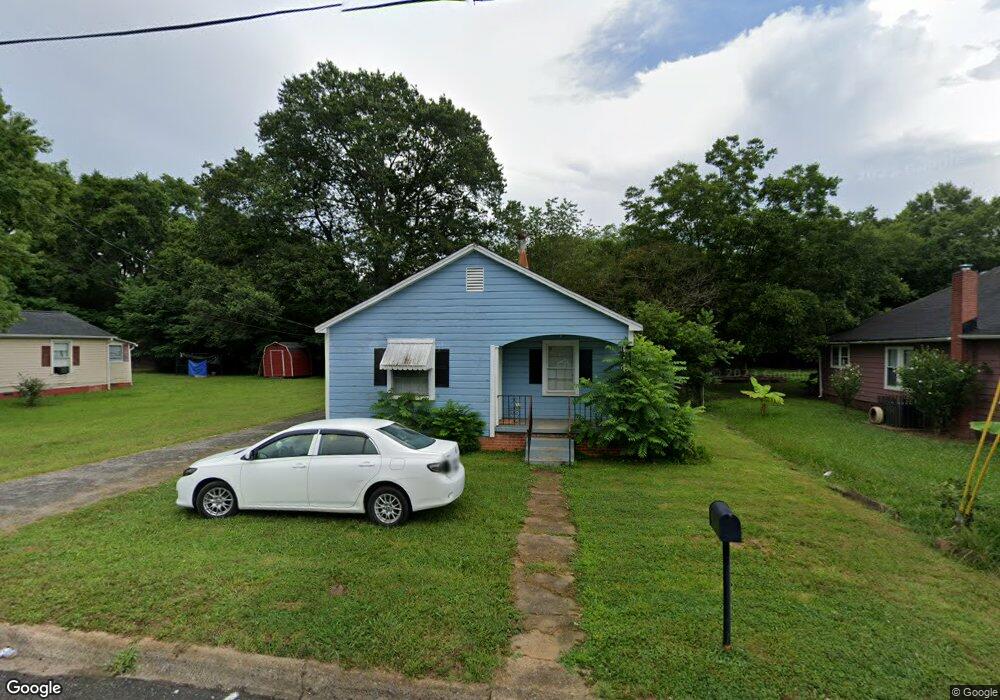
912 Logan St Shelby, NC 28150
Estimated Value: $89,072 - $142,000
3
Beds
1
Bath
1,005
Sq Ft
$114/Sq Ft
Est. Value
About This Home
This home is located at 912 Logan St, Shelby, NC 28150 and is currently estimated at $115,018, approximately $114 per square foot. 912 Logan St is a home located in Cleveland County with nearby schools including Jefferson Elementary School, Shelby Middle School, and Shelby High School.
Ownership History
Date
Name
Owned For
Owner Type
Purchase Details
Closed on
Oct 29, 2020
Sold by
Diaz Maria Del Socorro Paredes and Deldiaz Maria Del
Bought by
Diaz Maria Del Socorro Paredes and Vasquez Perez Miguel
Current Estimated Value
Purchase Details
Closed on
Jan 3, 2018
Sold by
Smith Caroline A
Bought by
Diaz Maria Del Socorro P
Purchase Details
Closed on
May 31, 2017
Sold by
Harris Gregory D
Bought by
Smith Caroline A and Smith Roger D
Purchase Details
Closed on
Jul 20, 2010
Sold by
Branch Banking & Trust Company
Bought by
Martin P Nathan
Purchase Details
Closed on
Jun 9, 2010
Sold by
Setola Linda and Setola Perry
Bought by
Branch Banking & Trust Company
Create a Home Valuation Report for This Property
The Home Valuation Report is an in-depth analysis detailing your home's value as well as a comparison with similar homes in the area
Home Values in the Area
Average Home Value in this Area
Purchase History
| Date | Buyer | Sale Price | Title Company |
|---|---|---|---|
| Diaz Maria Del Socorro Paredes | -- | None Available | |
| Diaz Maria Del Socorro P | $16,500 | None Available | |
| Smith Caroline A | $8,000 | None Available | |
| Martin P Nathan | $9,500 | None Available | |
| Branch Banking & Trust Company | $11,000 | None Available |
Source: Public Records
Tax History Compared to Growth
Tax History
| Year | Tax Paid | Tax Assessment Tax Assessment Total Assessment is a certain percentage of the fair market value that is determined by local assessors to be the total taxable value of land and additions on the property. | Land | Improvement |
|---|---|---|---|---|
| 2025 | $351 | $35,294 | $5,000 | $30,294 |
| 2024 | $292 | $22,144 | $2,500 | $19,644 |
| 2023 | $290 | $22,144 | $2,500 | $19,644 |
| 2022 | $290 | $22,144 | $2,500 | $19,644 |
| 2021 | $292 | $22,144 | $2,500 | $19,644 |
| 2020 | $362 | $27,334 | $2,500 | $24,834 |
| 2019 | $362 | $27,334 | $2,500 | $24,834 |
| 2018 | $360 | $27,334 | $2,500 | $24,834 |
| 2017 | $352 | $27,334 | $2,500 | $24,834 |
| 2016 | $351 | $27,334 | $2,500 | $24,834 |
| 2015 | $462 | $38,393 | $2,750 | $35,643 |
| 2014 | $462 | $38,393 | $2,750 | $35,643 |
Source: Public Records
Map
Nearby Homes